Tutorial Advanced Users
Contents
|
JUICE - Jams Model Editor
The JAMS Builder (JUICE) was developed in order to set up and/or configure environmental models. By using JUICE any models can be combined and configured by the "module principle". For this purpose, there are two types of "modules" available. On the one hand, those are components which describe the individual processes. On the other hand, there are context components which control the model run. For the data exchange between components and contexts attributes are needed. Those can be variables but also parameters.
JUICE: Structure and Scope of Use
The interface of the JAMS Builder will be explained below.
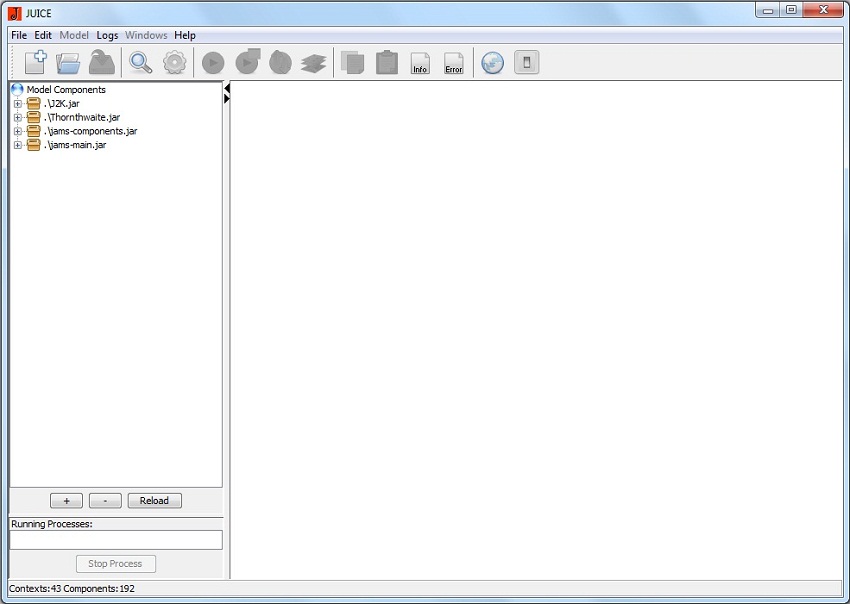
The installation of your JAMS creates a JAMS builder button on your desktop and in the Start menu. It refers to the JAMS User Interface Component Editor (JUICE). After starting JUICE the following window appears which is divided into three areas. In the top left window you can see the libraries which are loaded. The bottom left window shows the running processes. The right area shows the model.
Structure of the Menu Bar
The menu bar contains the items File, Edit, Model, Logs, Windows and Help. In addition, the following functions are integrated in the form of icons:
1. Open new model
2. Load model
3. Save model
4. Search function
5. Jams settings
6. Start model
7. Open JAMS Launcher
8. Open JAMS Datastore Editor
9. Open JADE
10. Copy model surface
11. Paste model surface
12. Show info log
13. Show error log
14. JAMS Website
15. Close
Under the menu item File models can be loaded, saved and closed.
The menu item Edit allows to edit, load or save settings and offers a search function.
Under the item Edit Preferences you can edit the libraries which are used, the extent of the output, the output of logs and information on the model window. Those settings can be saved for subsequent modeling under the item Save Preferences and they can be reused by clicking on Load Preferences.
The menu item Model is only activated when a model has been loaded. It can start or configure the model. Moreover, the JAMS Explorer is linked which is used for analyzing used input data and results of the modeling. Its scope of services is explained in detail in the Tutorial Basic User. Loading and saving parameter sets can be done by using Load Model Parameters and Save Model Parameters. In addition, the model can be started by using the JAMS Launcher. The Optimization Wizard serves as a platform for automatic parameter optimization.
Under the menu item Logs the Info Log can be shown. It contains information about the model's author, its version and user and also about the model's efficiency (How well displayed are the measured values in the model?), the model's structure (Which components were used how often?) and the time of the modeling. The Error Log shows errors which may have occurred.
The menu item Windows lists all windows which are currently open.
Under the menu item Help you can obtain online help by clicking on JAMS online.
Application of JUICE for Model Design and Model Configuration
Setting up a Model
The JUICE can set up models. In the following steps, the procedure is carried out exemplarily by using the ABC model.
Step 1
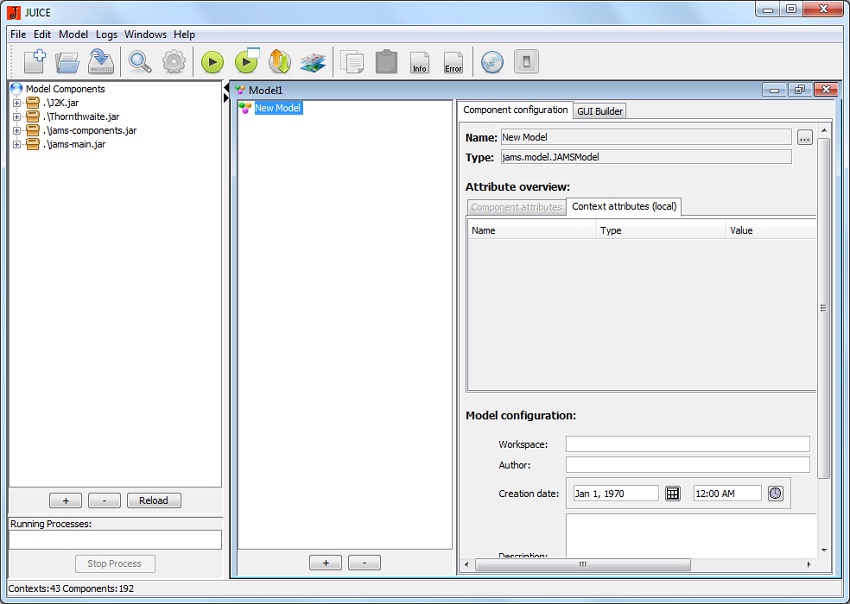
Select the item New Model in the menu item File. An empty model is opened. The left part of the opened window displays the (context) components which are part of the model. The right part of the window can show two different views. On the one hand Component Configuration where the model's (context) components are edited. Their attributes are linked. Moreover, a parameterization can be carried out. The second view shows the Surface Editor which can edit the model's surface.
Step 2
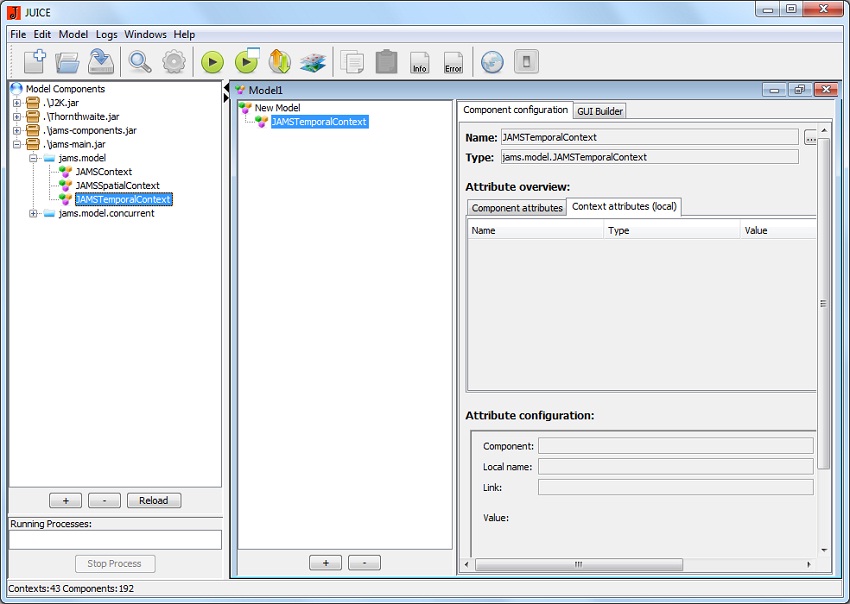
Create a context component of the Type "JAMS Temporal Context". It allows a temporal iteration of the simulation. Click on the library jams-main.jar which is listed in the top left window. There you will find the JAMSTemporalContext under jams.model. Drag it to the right window into the "New Model".
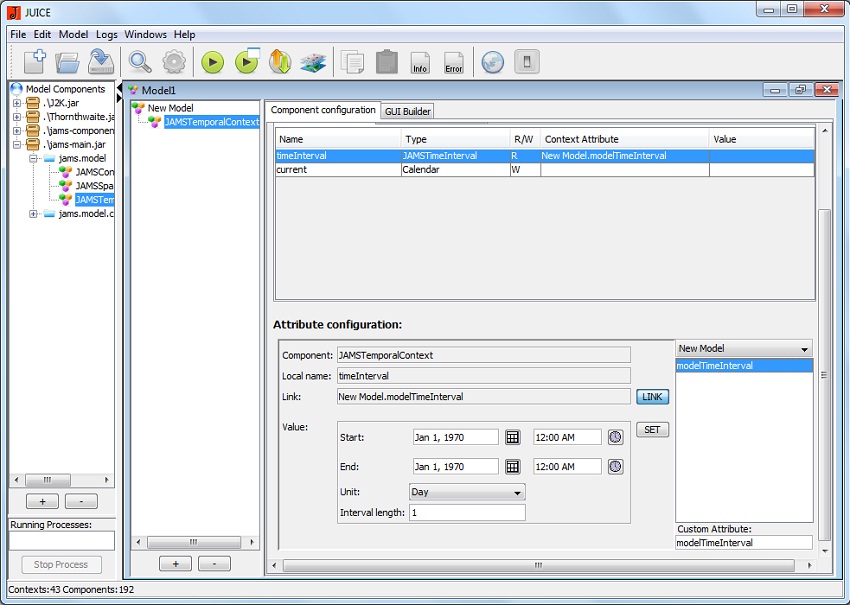
Create the context attribute modelTimeIntervall within the model. Click on Component Attributes in the Attribute List under the item New Model.
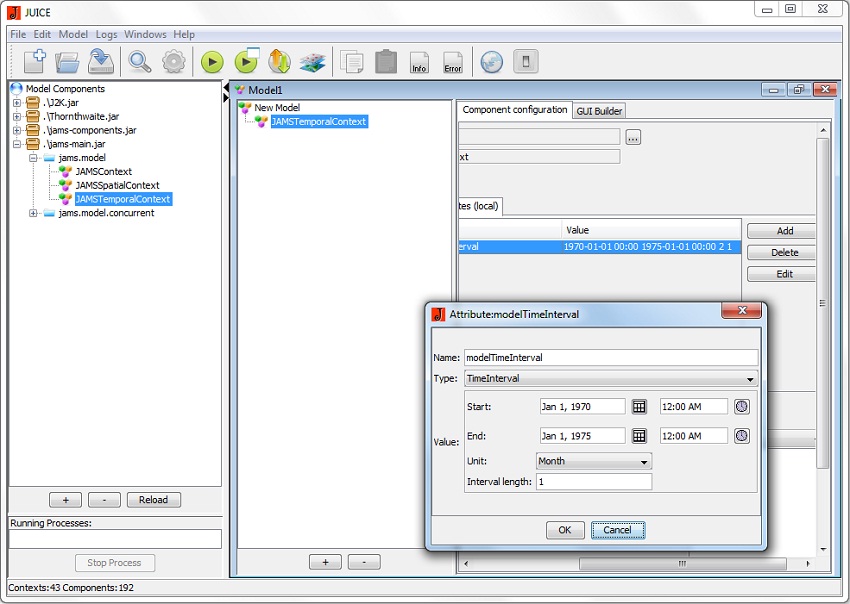
Click on Add. Take modelTimeIntervall as name. Select TimeInterval as attribute type. You have to determine a time span for the simulation. (Note that data for the selected time span have to be available.) Take 01.01.1970 to 01.01.1975 as time span. Select Month as temporal unit. Then click on SET. The attribute modelTimeIntervall is now linked to the time interval you selected.
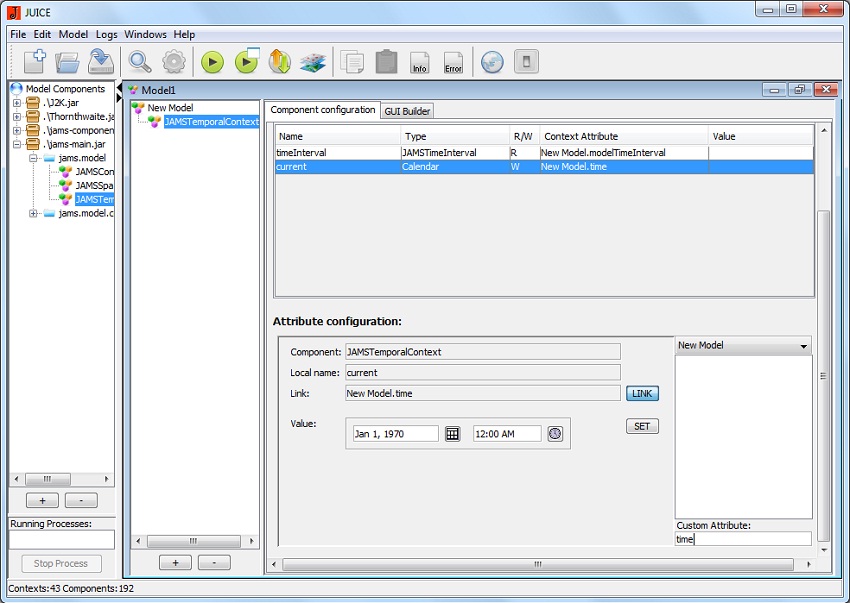
Go to component JAMSTemporalContext. Link the component attribute timeInterval to the model attribute modelTimeIntervall which has already been created. Select it from the attribute list in the bottom right box. Click on LINK.
Create a new attribute time and link it to the component attribute current.
Step 3
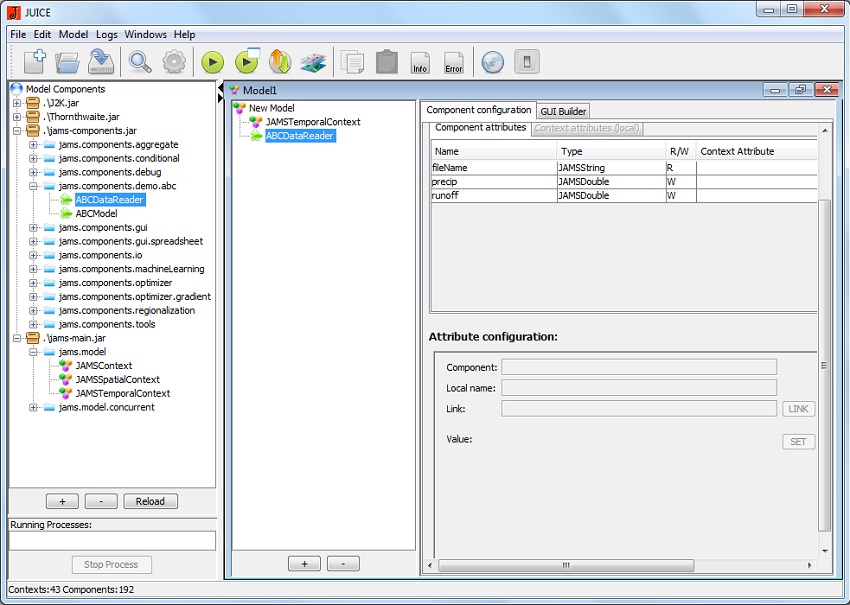
Add the component ABCDataReader to the model. You can find it in the library jams-democomponents.jar in the folder jams.components.demo.abc. The component ABCDataReader allows reading data. It reads the date and values for precipitation and runoff from a text file. This text file can be downloaded here: File:Abc.txt
The location of the data file has to be transferred to the component attribute fileName. For this reason, you have to enter the file path of your data file as value of the attribute fileName. Click on SET.
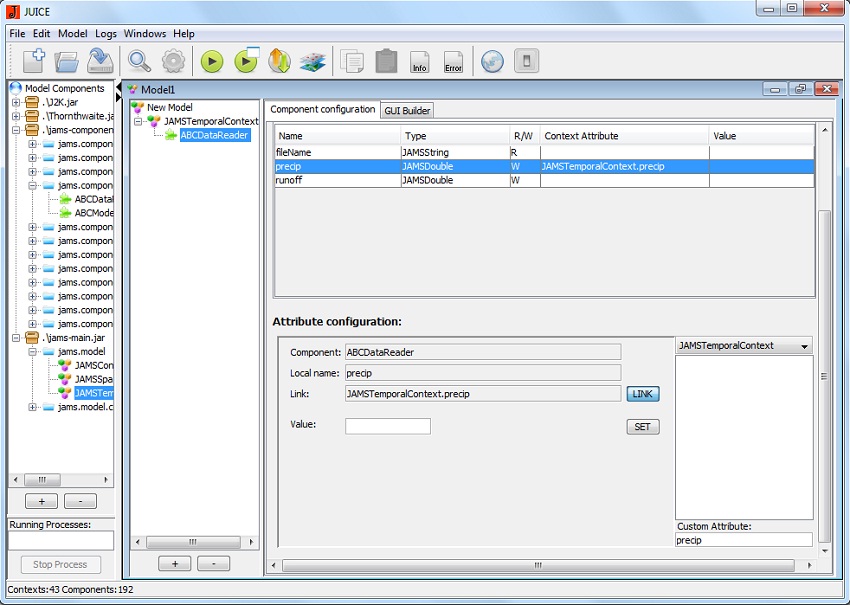
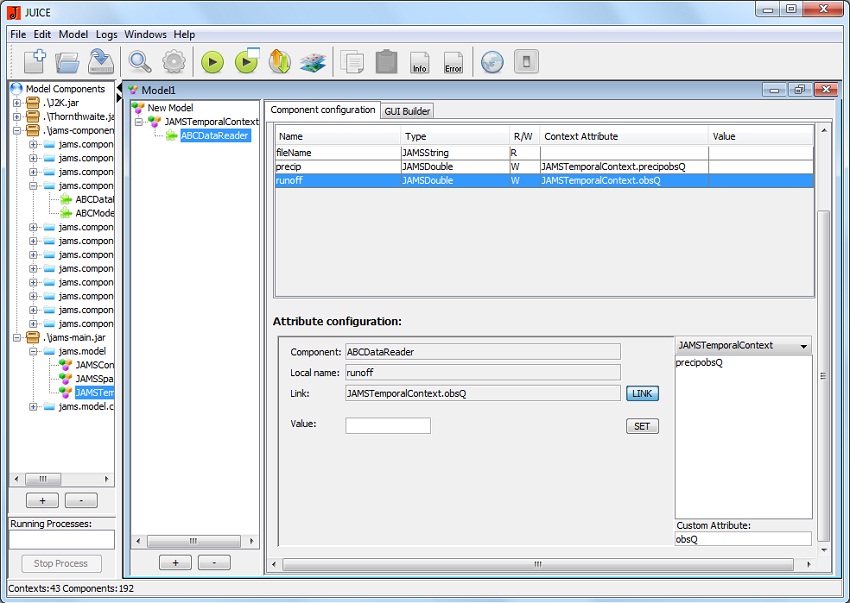
Create the attributes precip (for precipitation) and obsQ (for runoff measures) in the JAMSTemporalContext. They should contain the values of the precipitation and runoff which is measured for the current time step. Select the component attribute precip. It should be shaded in BLUE now. Enter the name precip into the box Modified Attribute. Click on LINK. The context attribute precip from the context JAMSTemporalContext has been created and linked.
Now select the component attribute runoff. It should be shaded in BLUE now. Enter obsQ into the box Modified Attribute
Click on LINK. The context attribute obsQ from the context JAMSTemporalContext has been created and linked.
Step 4
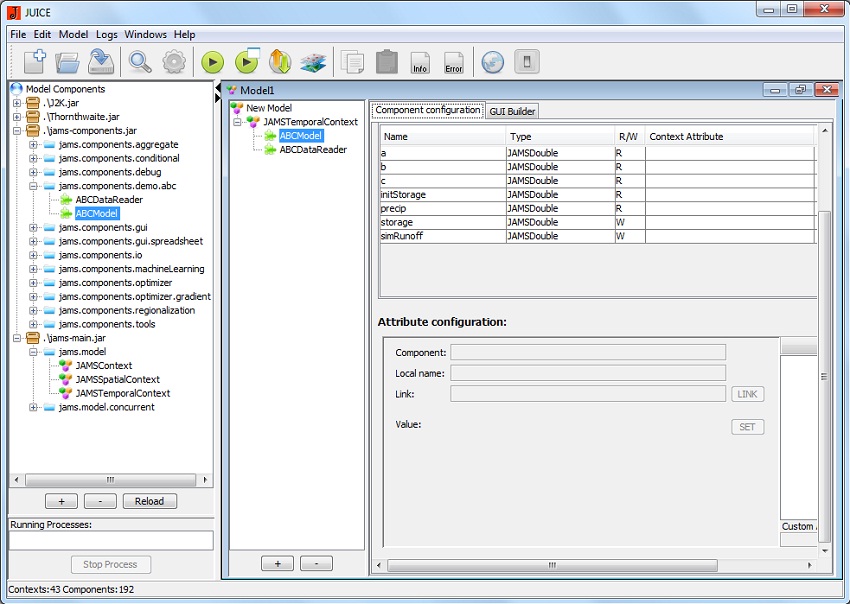
The central component of the model is the component of the ABC model. The ABC model is a linear model which relates precipitation and runoff to each other. Add the component ABCModel to the model. You will find it in the library jams-democomponents.jar in the folder jams.components.demo.abc.
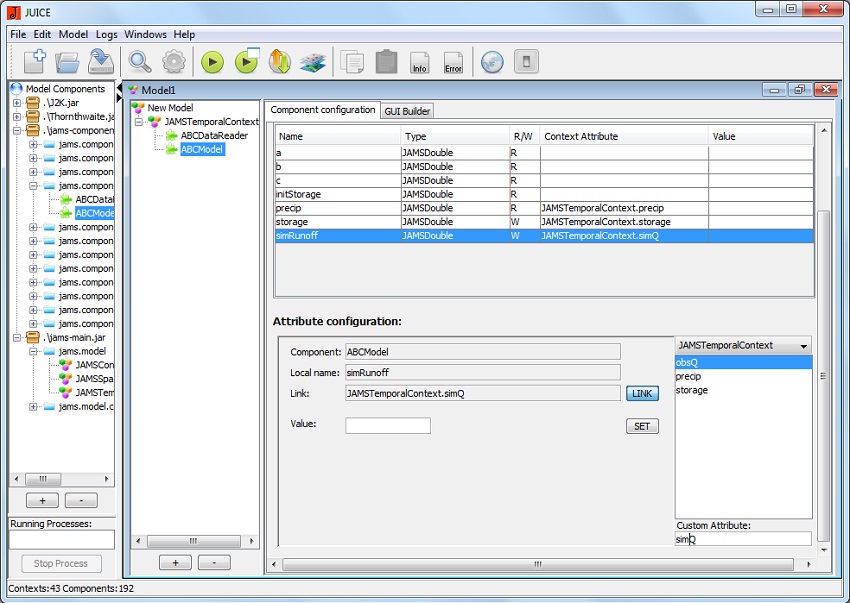
Link the precipitation data to the component. Select the component attribute precip. Select precip for the box Modified Attribute from the list of attributes which are already in the JAMSTemporalContext. Click on LINK. Create new attributes for the water storage (storage) and the simulated runoff (simQ) as desribed in Step 3. The following window should appear:
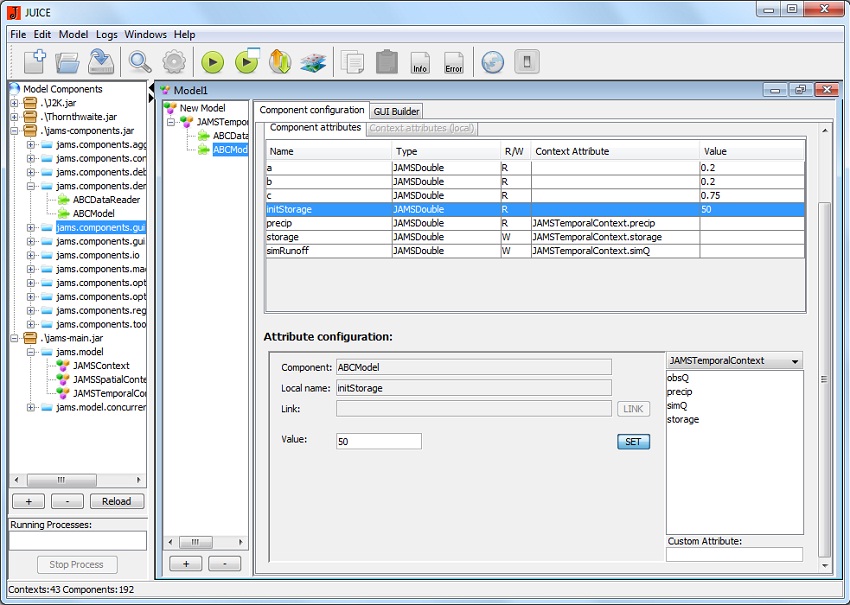
The component attributes a,b,c and initStorage allow the parameterization of the component. Assign the following values: a=0.2, b=0.2, c=0.75 and initstorage=50.
Step 5
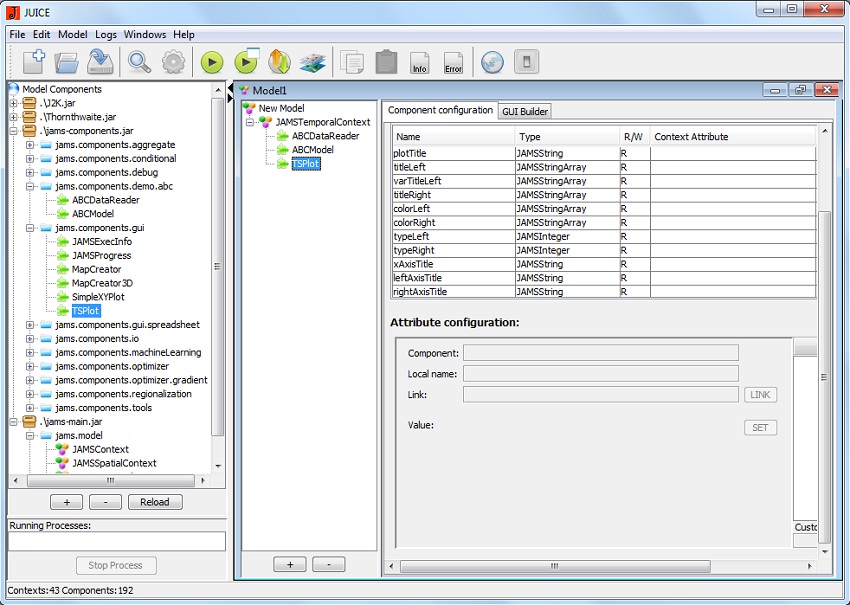
For the visualization of results you need the component TSPlot. Add this component to the model. You will find it in the libary jams-components.jar in the folder jams.components.gui.
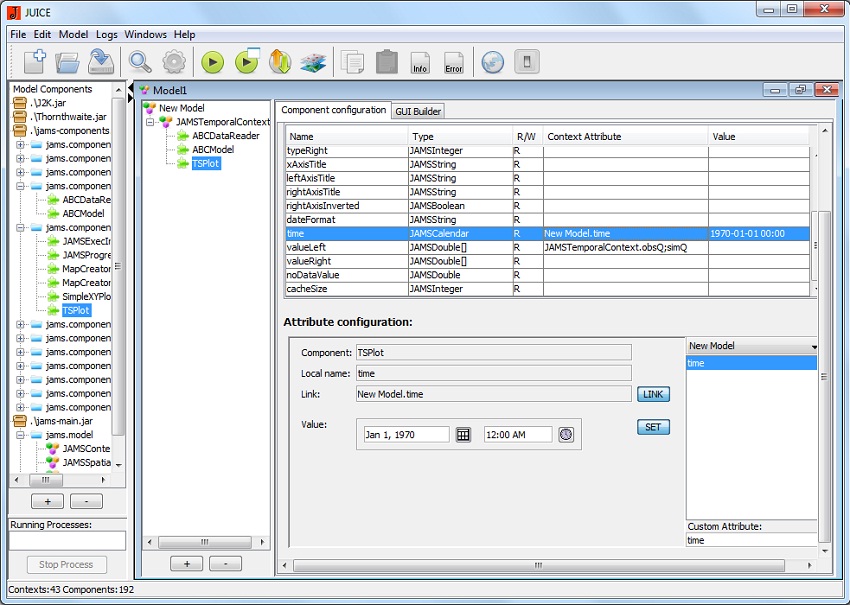
Link the component attribute time to the attribute time from the context New Model. Select the component attribute time. Select the context New Model from the bottom right box and select the attribute time. Click on LINK. Link the component attribute valueLeft to the attributes simQ and obsQ from the JAMSTemporalContext. If you want to link one component attribute to more than one context attribute, you have to separate them by semicolon. The following window should appear:
Step 6
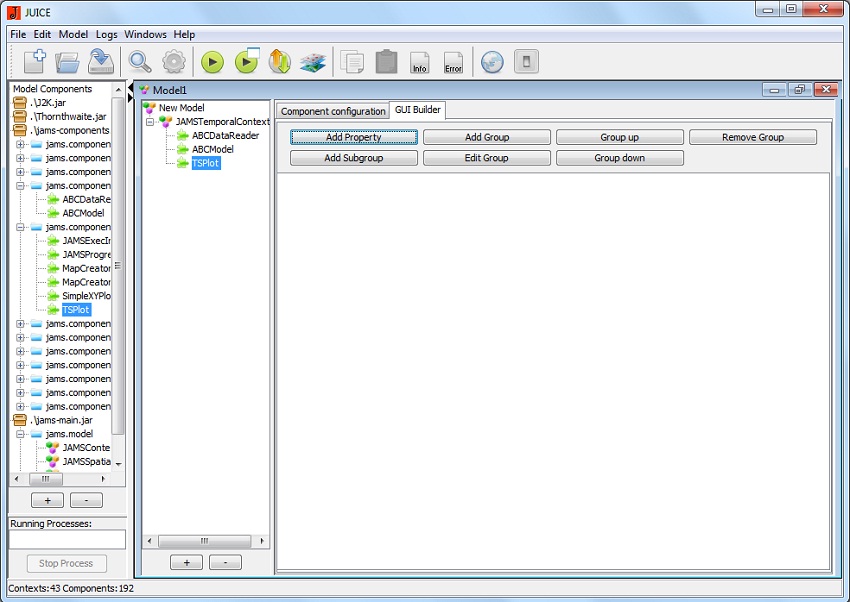
Now a model surface is to be created for the ABC model. Go to view GUI Builder.
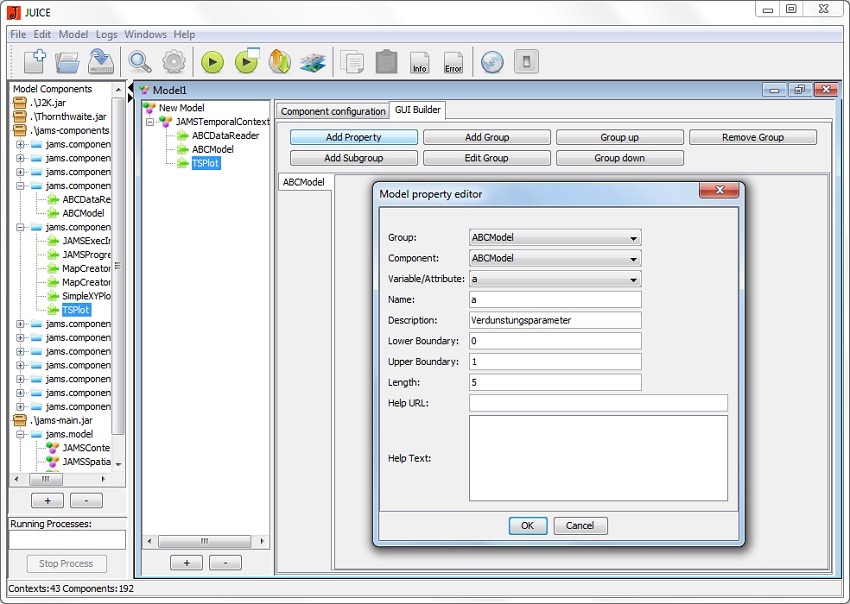
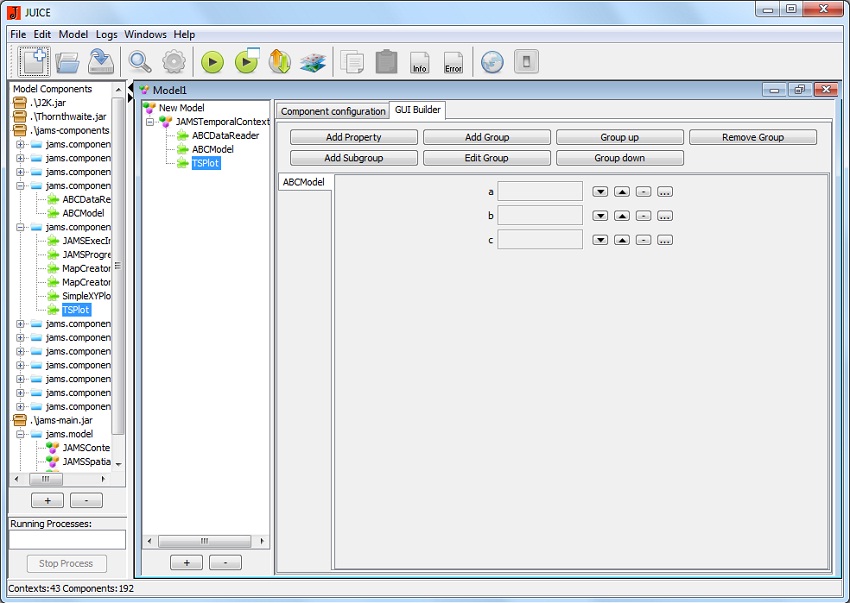
The attributes a,b, and c are to be edited on the model's surface. In order to do that, create a new group clicking on add Group and give it the name "ABC model". By clicking on the button Add Property one box has to be created for each attribute. Note that the attribute has to be linked to the right component. In addition, the range of values can be defined by an upper and a lower boundary for the attribute. For example, the entries for parameter a in the parameter editor look like this:
The group ABC Model is now finished and should look like this:
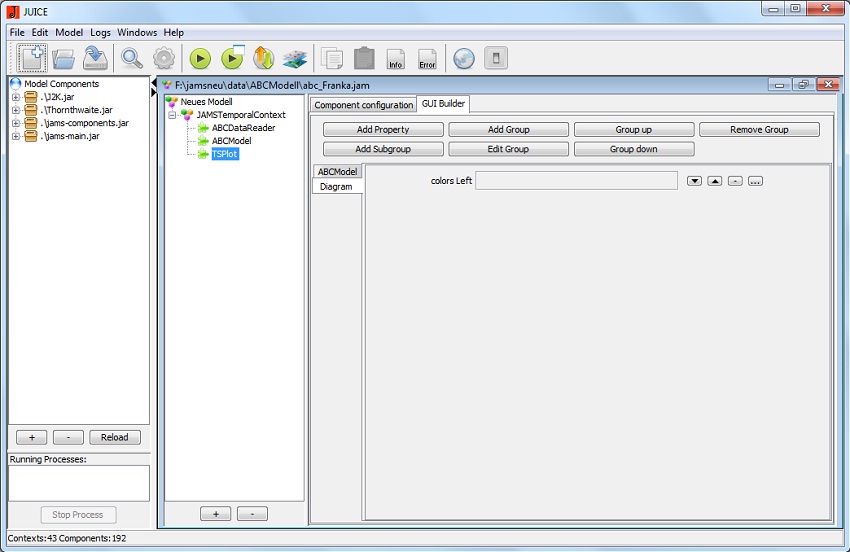
Moreover, the display of results of the modeling in terms of color should be adjustable in the diagram. Therefore, create a new group clicking on Add Group and name it "diagram". Create editors for the attribute colorLeft. Name it colors left and link the created attributes to the attributes of the component TSPlot.
The group diagram is now finished and should look like this:
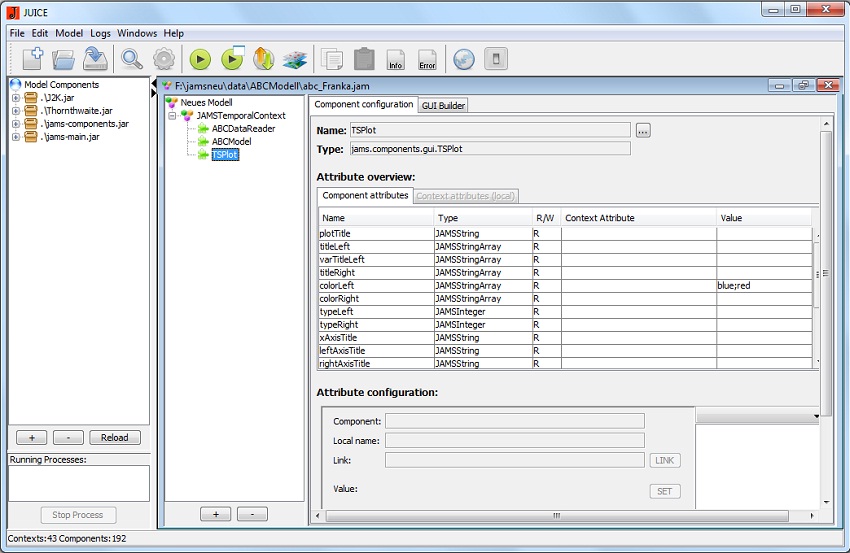
In order to link the colors of the outflow curves, go to TSplot component configuration. In the field colorleft enter the value blue;red. Doing so, the colors can be changed later during model runtime.
Step 7
Save the model.
The model is finished. Now you can launch it directly by using the JUICE or by using the JAMSLauncher. If you launch it via the JAMSLauncher, you can edit all attributes which have been linked to the model's surface..
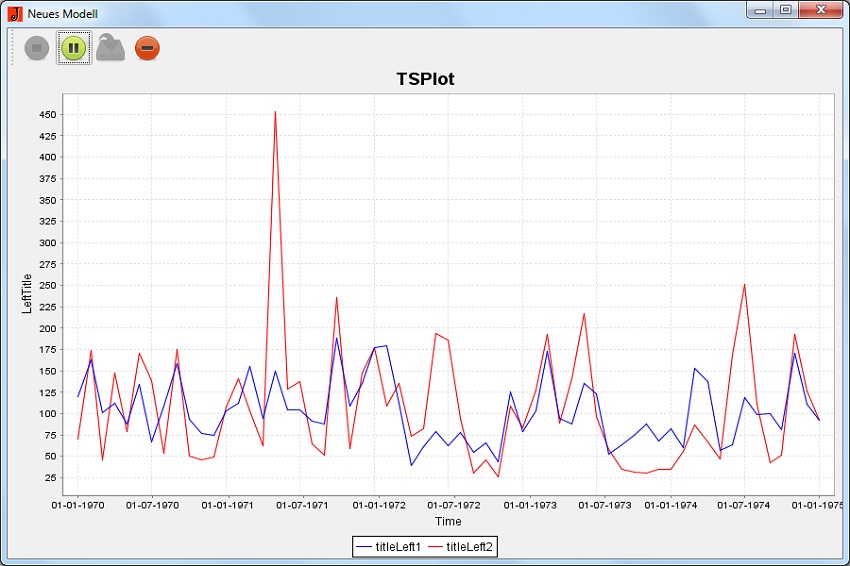
The following output window appears. The measured runoff is displayed in blue, the simulated runoff in red.
Configuring Model Components
JUICE allows the configuration of model components which makes it easy to change the parameterization of a component. The procedure will be explained by taking the component TSPlot from the ABC model of section "Setting up a Model" as an example.
An Example
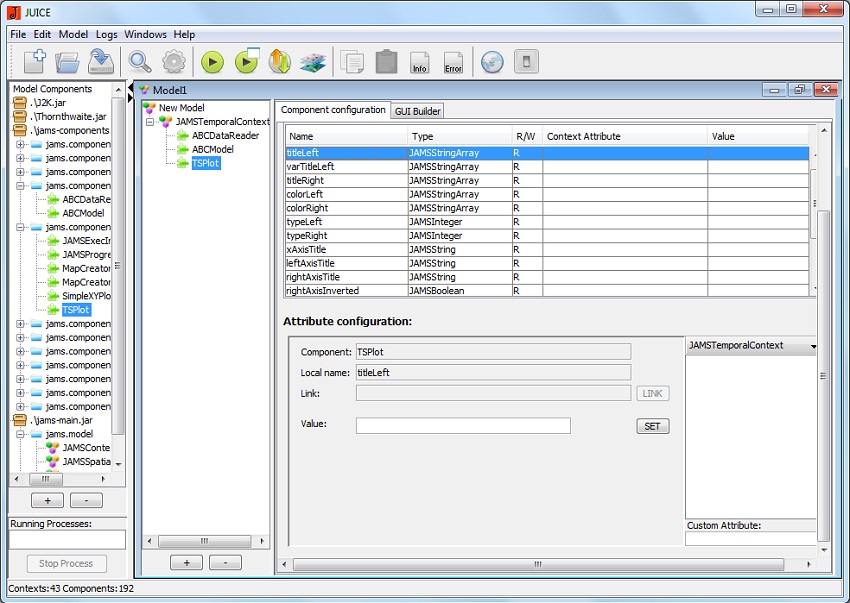
In the created model no parameter values for component attributes were defined. As a result, default values were assumed for the various parameters. Of course they can be modified in order to make the resulting diagram, which visualizes the results of the modeling, more attractive.
We set the following values for the modification:
- titleLeft (title of the left diagram axis) : simulated runoff; measured runoff
- titelRight (title of the right diagram axis): precipitation
- colorLeft (color shades of values displayed on the left): red; blue
- colorRight (color shades of values displayed on the right): gray
- typeLeft (type of graphic rendition, e.g. as line chart or bar chart): 0 (line)
- typeRight (type of graphic rendition, e.g. as line chart or bar chart): 1 (bar)
- xAxisTitle (title of x-axis): time
- leftAxisTitle (title of left y-axis): runoff [m³/s]
- rightAxisTitle (title of right y-axis): precipitation[mm]
- rightAxisInverted: 1
Moreover, the component attribute valueright has to be linked to precip from the JAMSTemporalContext to display precipitation values.
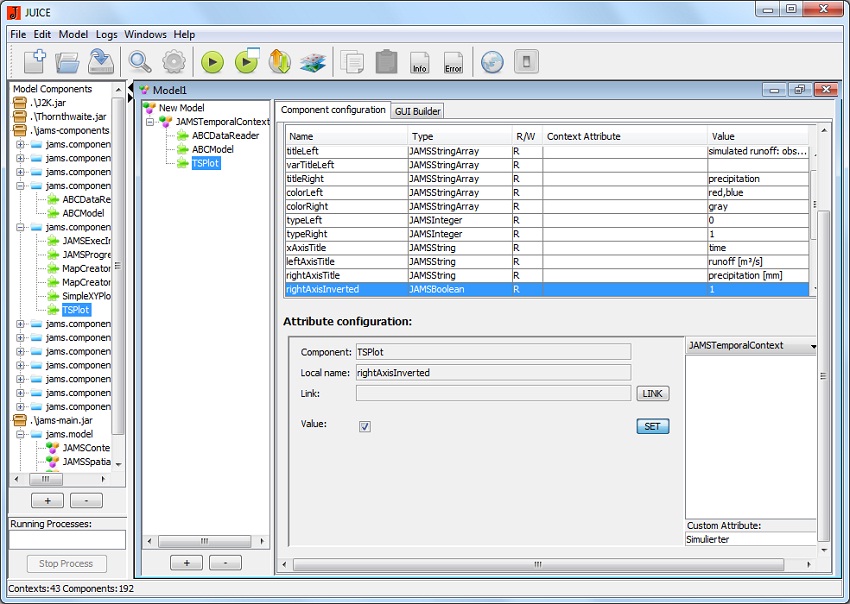
Overview of new attributes:
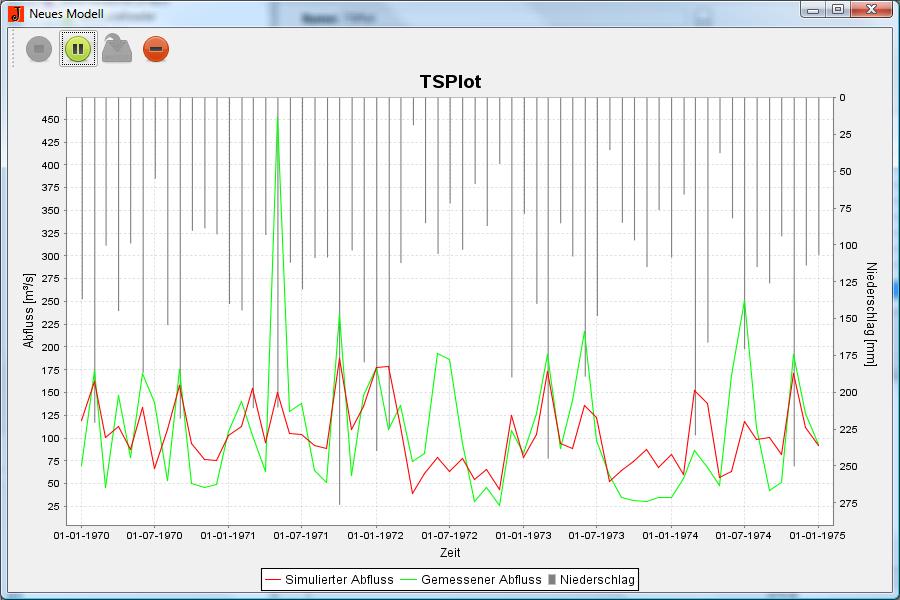
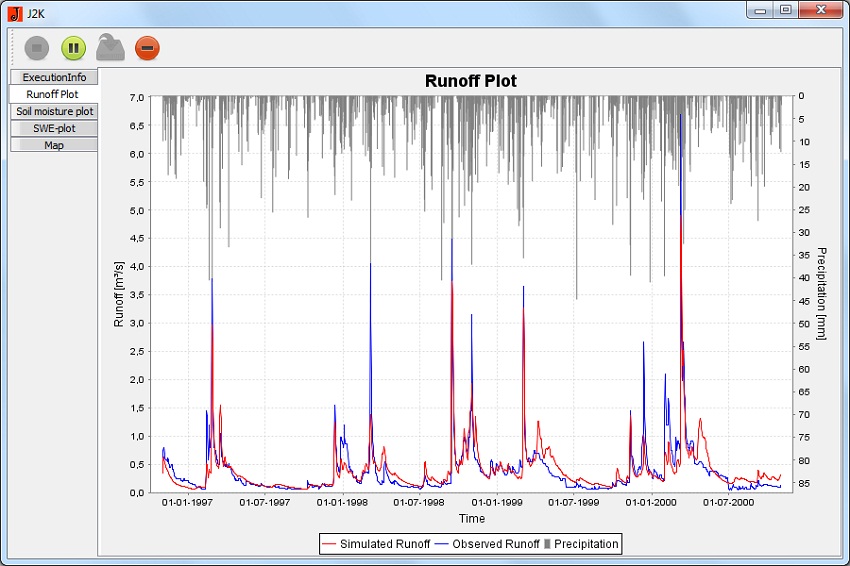
The following graph results from the modification:
Exchanging Components
The JUICE allows to substitute model components by other components. For this purpose, input and output attributes have to be accurately linked.
An Example
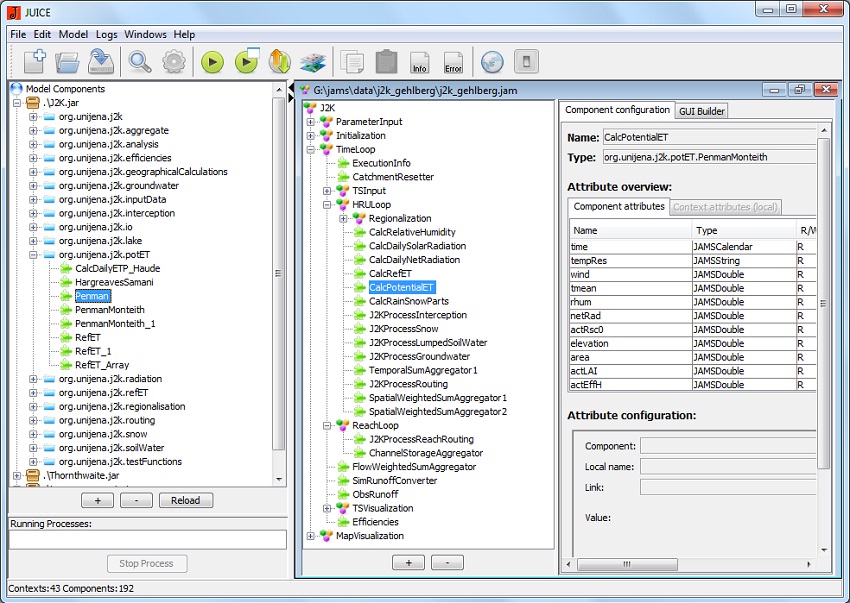
As an example, the component CalcPotentialET is substituted by the component Penman in the precipitation-runoff model J2K. Both components calculate the potential evaporation but each one using different algorithms.
Step 1: Open Model and Step 2: Delete Component
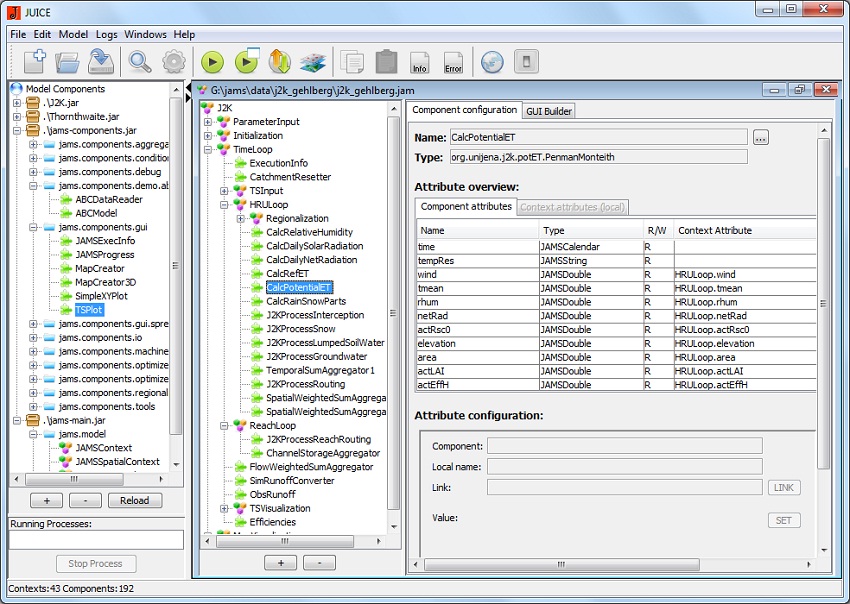
Load the model j2k_gehlberg.jam from the example data sets which were made available when downloading the software. Clicking on the component CalcPotentialET of the HRULoop creates the following image. Delete the component CalcPotentialET in order to integrate another evaporation component into the model. Right-click on the component and select delete.
Step 3: Add New Component
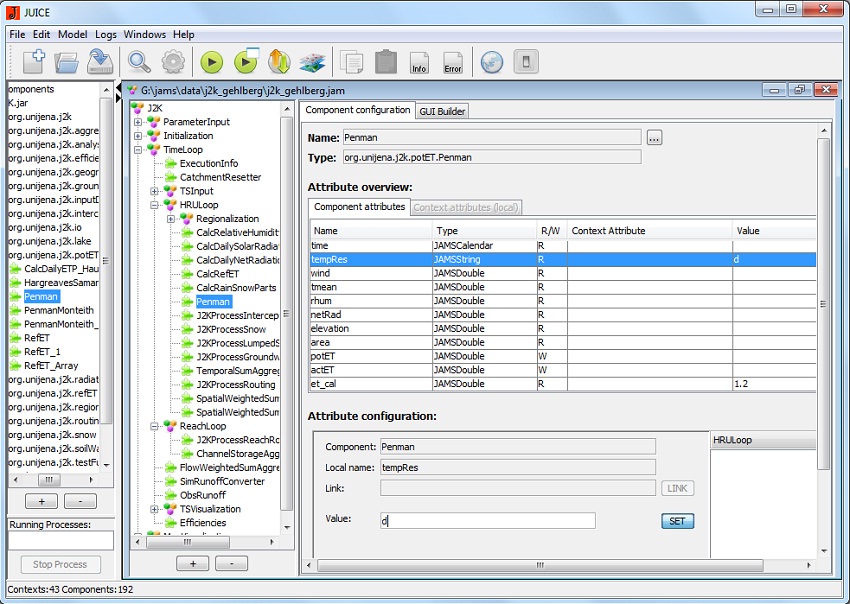
In the library J2K.jar in the folder org.unijena.j2k.potET you will find the component Penman. Drag it to the position of the former component CalcPotentialET.
Step 4: Parameterization
Assign the value d to the attribute tempRes and the value 1.2 to the attribute et_cal.
Step 5: Link Context Attributes
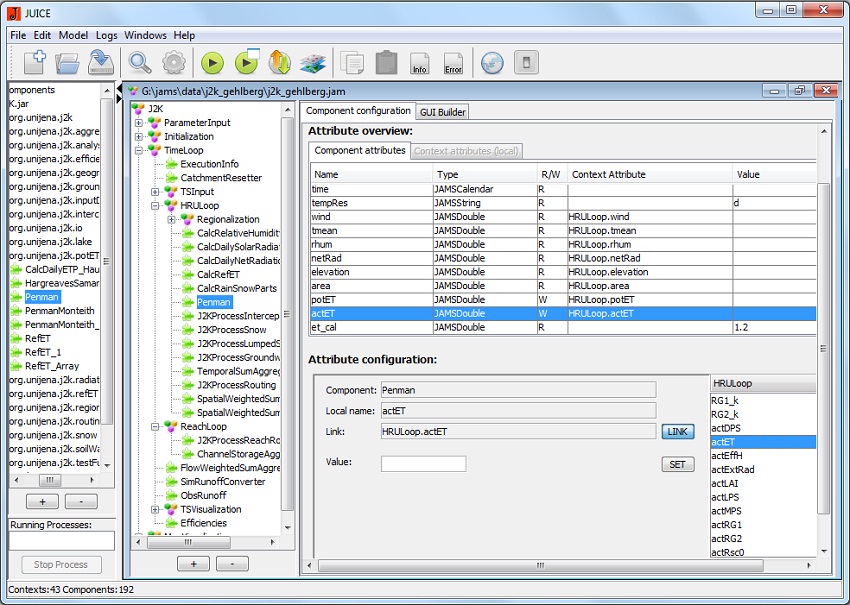
Link the context attributes wind,tmean,rhum,netRad,elevation,area,potET and actET to the corresponding context attributes of the HRULoop (interaction across all spatial units).
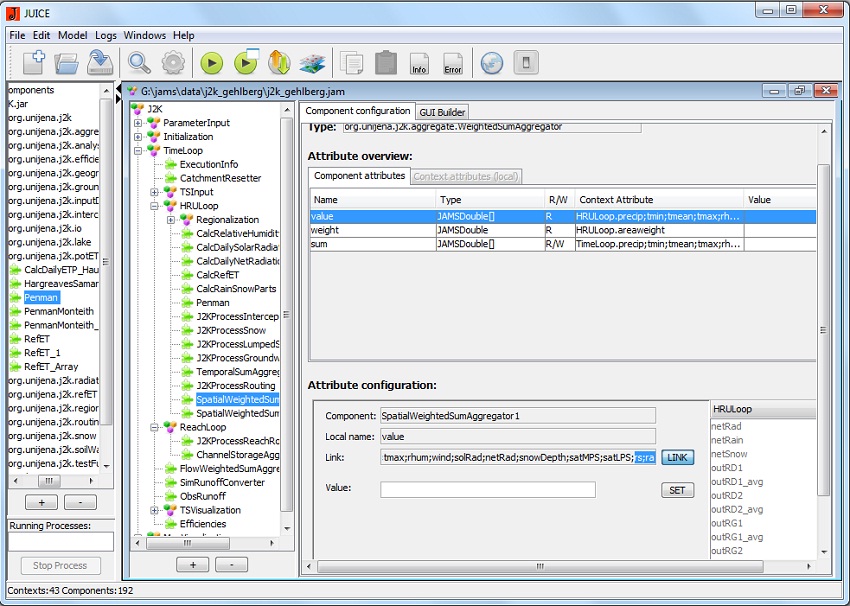
The former component which is used for calculating potential evaporation (CalcPotentialET) created the attributes rs and ra. Those attributes were summarized according to their importance in the component SpatialWeightedSumAggregator1. Since the new component does not create these attributes, they have to be deleted from links in the component SpatialWeightedSumAggregator1.
Select the component SpatialWeightedSumAggregator1 and delete the links of the component attribute value with the context attributes rs and ra by deleting these attribute from the box Modified Attribute and then linking them again.
Start the new model. The following image shows you the graph resulting from the modeling:
Generating a Model Documentation
(Hydrological) Models consist of various model components. In order to document your model in terms of its scientific basis as well as its software realization you have the JAMS-Doc software tool at your disposal which has been integrated into JUICE. Its functioning is described in detail in the Tutorial Model Documentation.
Model Validation and Parameter Optimization
In order to apply hydrological models successfully it is necessary to define model parameters accurately. A direct measurement of the parameters is mostly not possible, too expensive or there is no clear physical relation. For those reasons the parameters are adjusted in a trial and error process in so far that the simulated factors (e.g. runoff) correspond best to the values measured. This task can be time-consuming and difficult if the corresponding model is complex or has a large number of parameters. Therefore it makes sense to automatize the optimization process with a software tool for the optimization of model parameters and sensitivity analysis which is available. The model validation serves to check the suitability of a model for a specific purpose which was intended (Bratley et al. 1987) and is an important tool for quality assurance. A model is useful for an application if the simulation is reliable with regard to real processes (Power 1993). Subject to the purpose and type of the model different key figures and proof are required to validate the model. Its functionality is described in detail in the Tutorial Calibration and Sensitivity Analysis.
Debugging and Runtime Analyses Using Inspection Components
The Ping Component
In order to reconstruct the processing of your model, a component called Ping is at your disposal. It can be integrated into the model at every possible position and it makes a signal (ping) in the information log for the model runtime when it starts running. In addition, the Ping component shows how many times a component (e.g. within a temporal iteration - modeling during a few days - or within a spatial iteration - modeling within various spatial entities) has been recalled.
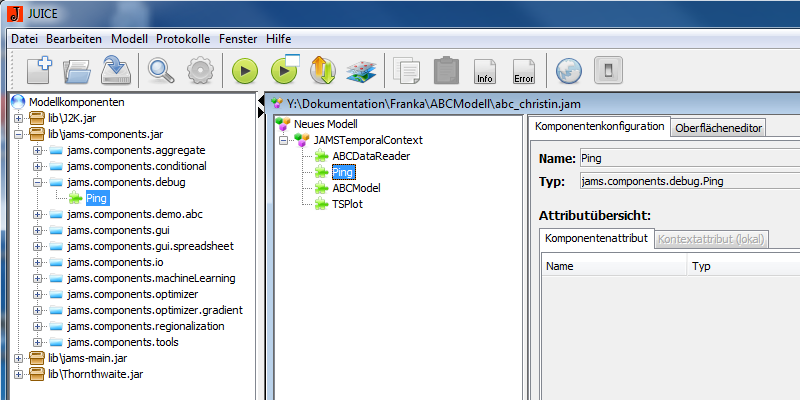
Below the Ping Component has been integrated into the ABC model which has been established in section 1.2.1 - Setting up a Model. The component can be found in folder jams-components in jams.components.debug.
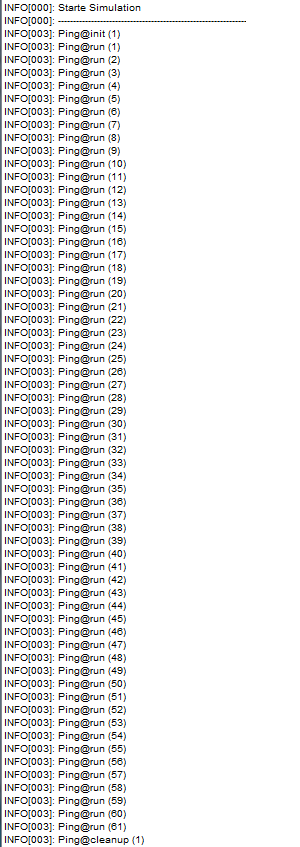
After the modeling, the following output can be found in the information log. This is saved in the JUICE under the menu item Protocols. It has to be noted that under the menu item Edit/Change Settings the output size has to be set to 2 or 3.
In this way, the user can see that the component Ping in the ABC model ran once during model initialization, 61 times during modeling (temporal context) and once during model cleanup.
Runtime Analysis
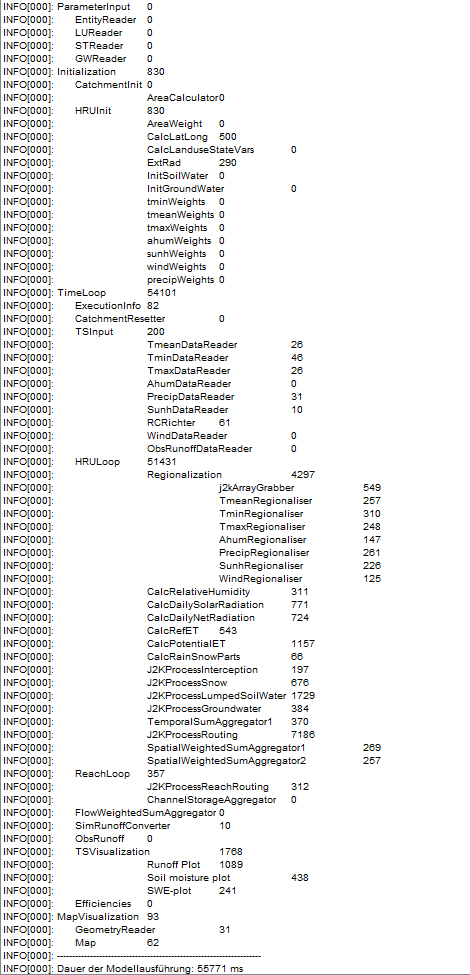
It is possible to show the individual components in the information protocol. This can be accessed in the JUICE under the menu item Protocols. This is saved in the JUICE under the menu item Protocols. It has to be noted that under the menu item Edit/Change Settings the output size has to be set to 2 or 3.
In the following image, the runtime analysis for the Gehlberg model is shown as an example. It can be downloaded at http://www.geoinf.uni-jena.de/5580.0.html.
Application of Different JAMS Execution Environments
The runtime environment (runtime system) makes different major services available for the model runtime in JAMS such as
- loading, starting, stopping and saving models
- a central logging system for error and information output (when loading and executing models)
- managing graphical model outputs
In order to adapt the execution of models to individual requirements, JAMS on the one hand serves as an interface for implementing one's own, adapted runtime environments by advanced users. In order to allow more unexperienced users to adapt the runtime environments to their own requirements, a default runtime environment was developed including various configuration options. Among these are especially the control of model output size and an option for deactivating all graphical model elements which is required for model execution on computers without graphical user interface. The latter is activated when starting JAMS by the command line (prompt in Windows) by indicating the parameter "-n" (or "--nogui"). Since there is no graphical interface for loading models, the model has to be indicated using the parameter "-m" (or "--model") In this way, for example the model J2000 can be executed by using the following command: C:\Program Files\jams>jams.bat -n -m data\j2k_gehlberg\j2k_gehlberg.jam
As a result, the runtime environment loads the model and executes it immediately. Graphical model components which may exist are not loaded, all model outputs are carried out in the command line and they are written -- if configured -- in the corresponding log files. Using this methodology, the JAMS models can be carried out easily from remote servers by using a shell connection or automatized using a Batch script.
