HRUweb Tutorial
The WebHRU is a web tool which was developed to derivate hydrological response units (HRU) online. It was implemented in Python and calculates HRUs according to GRASS-GIS algorithms.
Fragen:
- Bezeichnung der 2. Unterteilung: Procedure, Workflow oder Parameter Settings?
- Legend description am Anfang?
Contents |
Starting WebHRU Tool
Link to HRU Tool: http://intecral.uni-jena.de/hruweb
Structure of user interface
The map window is located in the centre. By using the arrow buttons or the +/- tool bar in the top left, the view can be set manually. The remaining items are located around the map:
- Table of layers
- - By right-clicking on the overlays,the layers can either be zoomed or removed.
- - By using drag and drop, the order of layer visibility can be changed.
- Legend (description see below)
- Processing step description and manual input/settings. Buttons for 'Run' and 'Next'.
- Download browser (provides data layer as raster or shape file)
- Server processing log: shows the uploading process

Legend description

- Zoom to map extend: restores smallest possible scale of the map
- Zoom in the map (
 ) or zoom out of the map (
 )
)
- Zoom to previous map extend (backward
 forward)
- Create bounding box of interest (see section Step 2)
- Relocate gauge (see section Step 6)
- User login (=> NEXT STEP)
Step 0: Data Preparations
First of all: Do user login!
Otherwise, your work will not be saved!
![]()
Then, open your input data in a GIS and check them for:
- completeness: At least DEM and gauges are required for delineating HRUs. The rasters of landuse, soil and geology are optional input.
- projection: The coordinate system has to be metric (like e.g. UTM) in order to enable distance calculations.
- layer extend: The layers should have at least the size of the catchment. A base map could be helpful.
| Input data | Description | Format | |
|---|---|---|---|
| DEM | Raster of Digital Elevation Model | Tiff (.tif) or .zip-file | mandatory |
| Gauges | Layer of gauging stations | .zip-file | mandatory |
| Landuse | Raster of landuse | Tiff (.tif) or .zip-file | optional |
| Soil | Raster of soil | Tiff (.tif) or .zip-file | optional |
| Geology | Raster of geology | Tiff (.tif) or .zip-file | optional |
The following sections describe the single substeps in the WebHRUTool. Each substep is divided into the subsections Aim, Procedure and Results.
Step 1: Uploading Input Data
Aim: Define base map and upload input data.
Procedure:
- At first, decide which map source should be used as the base layer (default: OpenStreetMap):

- Then, upload the required input data (required data described in Step 0).
- The projection of the map will be set automatically on the basis of the input data.
- For starting the uploading process, click 'Run'.

Results:
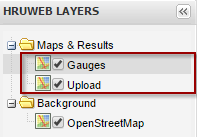
- The overlays 'Upload' and 'Gauges' are created.
- //Note: If the 'Upload' or the 'Gauges' layer are removed, the whole uploading procedure has to be done again by reloading the page.


- They can be downloaded from data browser.
- File:Databrowser step1.png
When finished, click 'Next'.
Step 2: Data Setup
Aim: Define area of interest for delineating HRUs.
Procedure:
- To zoom into the area of interest, right-click on the 'Upload' layer and choose 'Zoom to layer extend' or use the magnifier to do so.
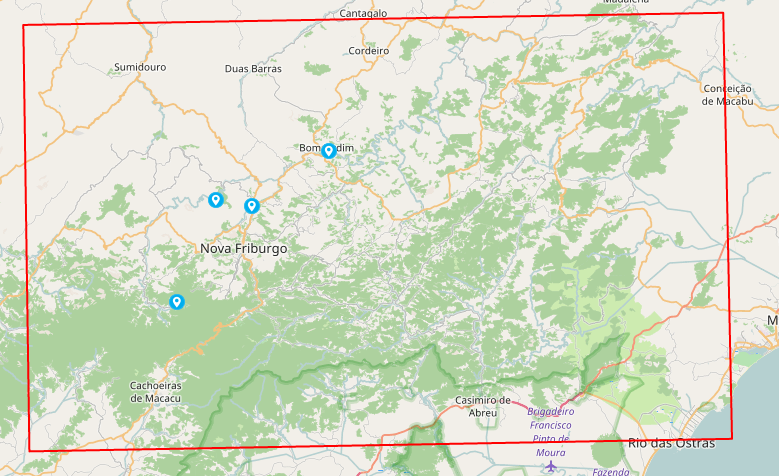
- The gauges are shown in light blue dots. The area of the gauges is marked automatically in a red bounding box.
- //Note: The red box marks the maximum extend. Data outside of this extend are not delineated.

- If the red bounding box does already represent your region of interest, you can skip the next step and click 'Run'.
- If you want to specify your region of interest, click on the box symbol
 in the GRASS-HRU MAP menu.
- By clicking on the symbol, another overlay layer called 'Region' is created and the automatically set bounding box is now covered by a blue box.

- This blue box represents the area that should be used for delineating HRUs later on. Due to computational reasons, its extend should
- be fitted to the gauges' positions.
- Fit it by clicking into the blue box and move it at the blue crosses.
- In order to shift the whole box, drag&drop it by the blue cross in the centre.
- In order to resize the box, use the cross at the side.
- //Note: The 'Region' layer can be removed without problems. To do so, right-click on the layer and choose "remove".
By clicking on, the region layer can be restored again.
- //Note: If the extend of the blue box is chosen too small, important parts for delineating HRUs could be left out which makes the results unusable.

- For starting the process, click 'Run'.
Results:
- A 'Hillshade' overlay is created.


- The hillshade layer can be downloaded from data browser.
When finished, click 'Next'.
Step 3: Data Preparation
Aim: Preprocess the DEM by filling its sinks.
- If the DEM was already preprocessed that way, no sink filling is necessary.
- Otherwise, it is recommended to do so in order to prevent lack of data.
Procedure:
- Choose "Filling" (default), if the sinks should be filled or "No filling", if they should not be filled.
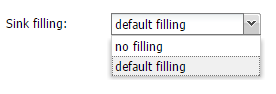

- For starting the process, click 'Run'.
Results:
- A DEM with filled sinks is created.
- File:Overlays step3.png
- File:Filled dem.png
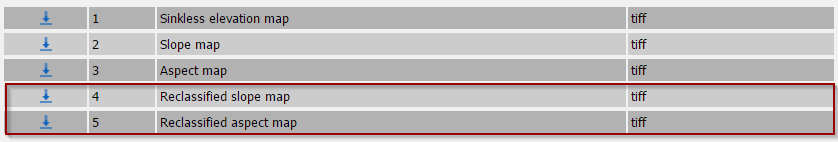
- Single maps of sinkless elevation, slope and aspect can be downloaded from data browser.

- //Note: If filling fails, no maps for slope and aspect are available.
When finished, click 'Next'.
Step 4: Reclassification
Aim: Reclassify terrain attributes.
Procedure:
- In this step, the class ranges of slope and aspect can be reclassified and renamed.
- In order to change table entries, click in the concerning field and type in the desired value.

- "Old": lists all existing class ranges
- "New": assigns IDs to classes
- For starting the process, click 'Run'.
Result:
- The reclassified layers 'aspect' and 'slope' are created.
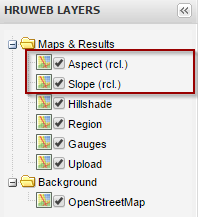


- The reclassified maps of slope and aspect can be downloaded from data browser as well.

When finished, click 'Next'.
Step 5: Waterflow
Aim: Define resolution of the stream network/ river system.
Procedure:
- With each subbasin, one river segment is created. In this step, the maximum number of cells (pixels) for a subbasin of the smallest size has to be specified.
- File:Eingabe der pixelzahl.png
- example 10.000
- For starting the process, click 'Run'.
Results:
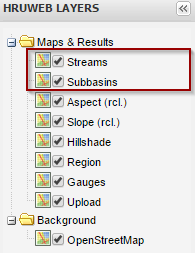
- The layers 'Streams' and 'Subbasins' are created.
- You can download a zip file of stream network + subbasin layer from data browser


When finished, click 'Next'.
Step 6: Outlets
Aim: Check the gauges' position and decide which gauges should be considered.
- While creating the subbasins, the gauges' position can differ from the stream network.
Procedure:
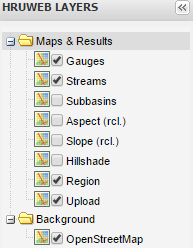
- First of all, use the drag and drop mechanism to change the visibility of the layers in the layer view (legend no. X).
- Order the layer of gauges on top, followed by the layer of river network.

- Open Google Earth and zoom in to the gauges. Now use the gauges' position in Google Earth
- as a reference and relocate the gauges in the map of your results.


- Now the tool for relocating gauges had to be activated. Click on
 in the legend to activate it.
- In order to relocate a gauge, click on a gauge and drag it to the proper river segment.

- //Note: If a gauge should not be considered in the further delineation of HRUs, just drag it out of the blue bounding box.
- File:OutOfBB.png

- For starting the process, click 'Run'.
Results:
- watershed overlay? - watershed map
When finished, click 'Next'.
Step 7: Dataoverlay & Generalization
Results: - HRU overlay - HRU map
== How to choose the best settings for ranges, HRU size+amount ==