Soil parameterization
m |
|||
| (51 intermediate revisions by 2 users not shown) | |||
| Line 1: | Line 1: | ||
| − | To develop soil parameterization file, first the depth of the different soil horizons and texture (combination of soil, silt and clay) in percentage is required. This information is general available in soil dataset. The texture information is useful to describe the characteristics of soil water retention curve. The soil texture information (in percentage) is provided as input data to the software component | + | [[pt:Parametrização_do_solo]] |
| + | To develop the soil parameterization file, first the depth of the different soil horizons and texture (combination of soil, silt and clay) in percentage is required. This information is general available in the soil dataset. The texture information is useful to describe the characteristics of the soil water retention curve. The soil texture information (in percentage) is provided as input data to the software component Rosetta inside 'HYDRUS-1D' to understand pedotransfer functions of soils in three different hypothetical pressure scenarios, namely: 0 mbar, 60 mbar and 15,000 mbar. The soil texture is classified according to the specific pore volumes of the soil (Scheffer and Schachtschabel 1984). | ||
For example, a soil type A has following depth and texture combination: | For example, a soil type A has following depth and texture combination: | ||
| Line 13: | Line 14: | ||
|- | |- | ||
|D Horizon || 35 || texture (49, 33, 18 ) | |D Horizon || 35 || texture (49, 33, 18 ) | ||
| − | |||
| − | |||
|- | |- | ||
|} | |} | ||
| − | The texture information needs to be supplied to HYDRUS 1D software to | + | The texture information needs to be supplied to the HYDRUS-1D software to obtain the water holding capacity of the specific texture combination: |
| − | *The HYDRUS 1D can be download from the following link: http://www.pc-progress.com/en/Default.aspx?hydrus-1d | + | *The HYDRUS-1D can be download from the following link: http://www.pc-progress.com/en/Default.aspx?hydrus-1d |
*Click Hydrus-1D Downloads--> | *Click Hydrus-1D Downloads--> | ||
| Line 44: | Line 43: | ||
[[File:Newproject_soiltypeA.png|soilType-A]] | [[File:Newproject_soiltypeA.png|soilType-A]] | ||
| − | On pre-processing | + | On the pre-processing window select the “Water Flow – Soil Hydraulic Parameters” |
The new window will appear: | The new window will appear: | ||
| Line 56: | Line 55: | ||
Select model of “% Sand, Silt and Clay (SSC)”. | Select model of “% Sand, Silt and Clay (SSC)”. | ||
| − | Input the percentage of SSC in the window. In this example, the SSC of A-horizon from the table above is provided. | + | Input the percentage of SSC in the window. In this example, the SSC of A-horizon from the table above is provided. In case the information is not available, users can put the qualitative information about the soil class under 'Textural class' of Input section. |
[[File:texture_input2.png|soilType-A]] | [[File:texture_input2.png|soilType-A]] | ||
| Line 64: | Line 63: | ||
Click ‘Accept’ and a new window will appear. | Click ‘Accept’ and a new window will appear. | ||
| − | Click ‘Next’ a new | + | [[File:waterflowparameter.png|water flow parameter]] |
| + | |||
| + | Note down the value in the volume Qr which is 'Residual Water Content' equivalent to wilting point. The value represents the water content in 15,000 mbar pressure. | ||
| + | |||
| + | Click ‘Next’, a new window will come up. | ||
[[File:waterflowboundary.png|soilType-A]] | [[File:waterflowboundary.png|soilType-A]] | ||
| Line 80: | Line 83: | ||
Soil profile summary table will appear | Soil profile summary table will appear | ||
| + | |||
[[File:soilprofilsummar.png|soil profile summary]] | [[File:soilprofilsummar.png|soil profile summary]] | ||
| Line 100: | Line 104: | ||
Double click the Soil Hydraulic Properties and a new graph will appear | Double click the Soil Hydraulic Properties and a new graph will appear | ||
| − | [[File: | + | [[File:Graph.png|graph]] |
| + | |||
| + | Keep the horizontal variable 'pressure head' and verticle 'water content'. | ||
Right click on the graph and click 'Edit Chart Data'. | Right click on the graph and click 'Edit Chart Data'. | ||
| + | |||
| + | A new window 'data grid editor' will appear. | ||
[[File:datagrid.png|Data Grid]] | [[File:datagrid.png|Data Grid]] | ||
| − | The C1 is pressure and C2 is water holding capacity | + | The C1 is pressure (mbar) and C2 is water holding capacity (%) |
| + | |||
| + | Take a note of the pressure of 0, 59.9 and related water holding capacity. Since, the water content equivalent to 15,000 mbar is not available, the vaule is taken from Qr (Residual Water Content) which has been described earlier. You will get the values 0.39, 0.35 and 0.05 respectively. | ||
| + | |||
| + | By substracting water content value from 60mbar to 0 mbar (i.e. 0.39-0.35 = 0.04) will give the water available in large pore storage. The soil can hold water available in LPS against the gravity. By substracting water content value from 15000 mbar to 60 mbar (i.e. 0.35-0.05 = 0.30) will provide water available in middle pore storage. This state of water availability is also known in field capacity. | ||
| + | |||
| + | The total volume of MPS and LPS can be derived by multiplying MPS and LPS value with respective soil depth (mm) of A horizon. i.e. 150 * 0.30 = 45 (MPS) and 150 * 0.04 = 6 (LPS) as shown in Figure below for A horizon. By considering all the available horizon as shown in the first place, the following information can be derived. | ||
| + | |||
| + | [[File:MPSLPS.png|Table]] | ||
| + | |||
| + | <!--The information in D (water content in different pressures) are derived from the Hydrus-1D as explained above. The value for column E and F are derived by substracting water content values within different pressure conditions. The value G is derived from multiplying MPS and LPS with depth.--> | ||
| + | |||
| + | The following MPS values of each horizon have to be equally divided into each 1 dm zone of respective soil horizone in the parameter file as shown in the figure below. | ||
| + | |||
| + | |||
| + | [[File:MPSLPSmethod.png|Table]] | ||
| + | |||
| + | |||
| + | For example in the table above, the value for fc_1 (field capacity:MPS) for first 1 dm is 0.30 because MPS in A horizon (15 cm) is 0.30. The next fc_2 (2 dm) layer is located in between A and B horizon. Therefore, the average has to be taken from the MPS value of A and B horizon (i.e. 0.30+0.31 = 0.305). The MPS value in each 100 mm is converted to 1 dm by multiplying with 100. The MPS value for each dm is provided until 22 dm as shown in figure below. | ||
| + | |||
| + | |||
| + | [[File:Soil_para_F.png|soilParameter_soilTypeA]] | ||
| + | |||
| + | |||
| + | In this case, the value is provided until fc_9 because the total soil depth is only up to this depth (i.e. 90 cm). Below this depth, there is no soil, therefore, the value is kept zero until fc_22. The air capacity (aircap) is equivalent to large pore storages (LPS) of soil which is 49 in this case. The value for LPS does not need to be divided into the different soil depth. kf_max and kf_min is the maximum and minimum soil conductivity of the soil type. In case these values are not available, users can put the 2 and 1 for maximum and minimum values. | ||
| − | + | Users has to provide the numerical id for each soil type. For example, the soil type A from the example is provided the id 9 in the parameter file. | |
Latest revision as of 13:40, 10 March 2013
To develop the soil parameterization file, first the depth of the different soil horizons and texture (combination of soil, silt and clay) in percentage is required. This information is general available in the soil dataset. The texture information is useful to describe the characteristics of the soil water retention curve. The soil texture information (in percentage) is provided as input data to the software component Rosetta inside 'HYDRUS-1D' to understand pedotransfer functions of soils in three different hypothetical pressure scenarios, namely: 0 mbar, 60 mbar and 15,000 mbar. The soil texture is classified according to the specific pore volumes of the soil (Scheffer and Schachtschabel 1984).
For example, a soil type A has following depth and texture combination:
| Horizon | Depth (cm) | Texture (Sand,Silt,Clay %) |
|---|---|---|
| A Horizon | 15 | texture (47, 39, 14 ) |
| B Horizon | 15 | texture (40, 42, 19 ) |
| C Horizon | 25 | texture (33, 40, 27 ) |
| D Horizon | 35 | texture (49, 33, 18 ) |
The texture information needs to be supplied to the HYDRUS-1D software to obtain the water holding capacity of the specific texture combination:
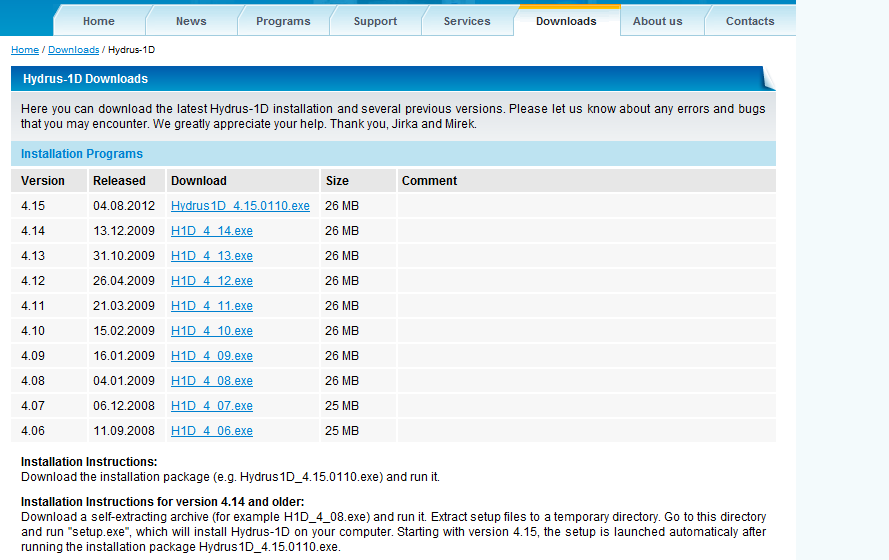
- The HYDRUS-1D can be download from the following link: http://www.pc-progress.com/en/Default.aspx?hydrus-1d
- Click Hydrus-1D Downloads-->
- Download the latest version (In this tutorial, version Hydrus1D_4.15.0110 is downloaded)
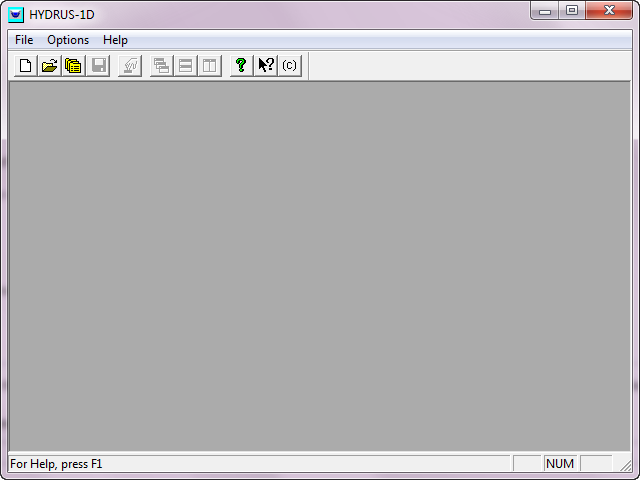
- Open the software:
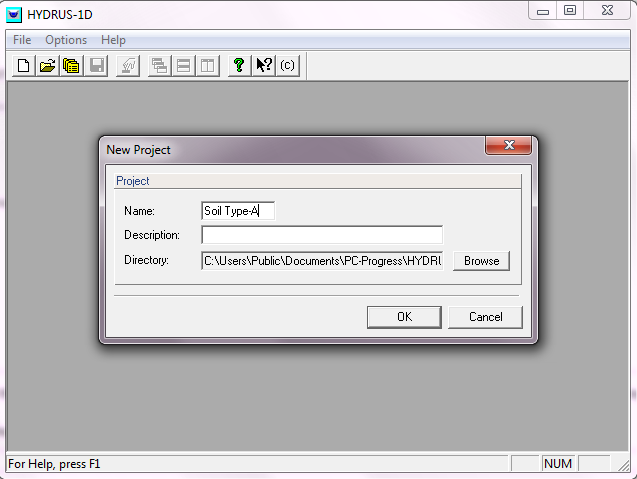
Click File--> New-->>
Give the name for the new project. For example: Soil type-A
Click OK
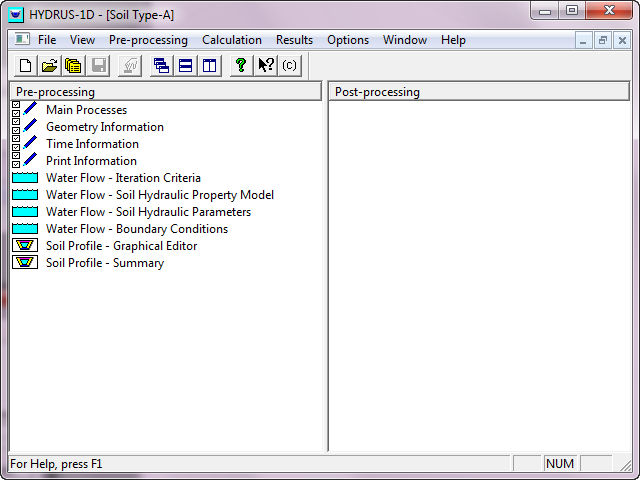
A new window with new project name will appear:
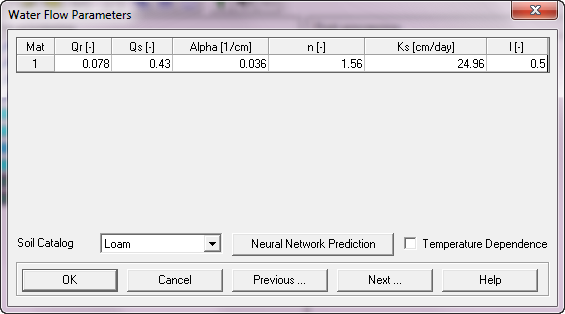
On the pre-processing window select the “Water Flow – Soil Hydraulic Parameters”
The new window will appear:
On this window, select the “Neural Network Prediction”.
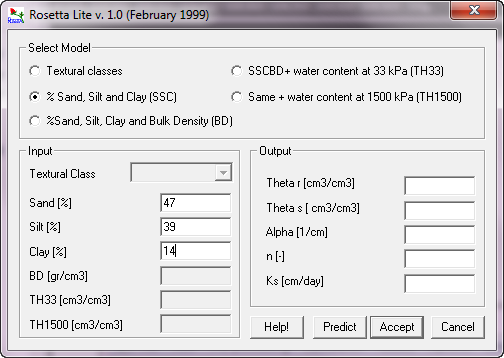
A new window will appear:
Select model of “% Sand, Silt and Clay (SSC)”.
Input the percentage of SSC in the window. In this example, the SSC of A-horizon from the table above is provided. In case the information is not available, users can put the qualitative information about the soil class under 'Textural class' of Input section.
Click ‘Predict’ and the Output will be resulted.
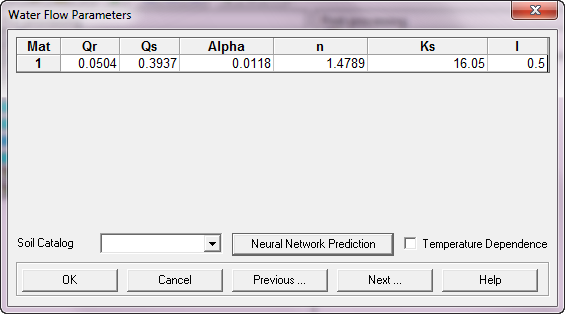
Click ‘Accept’ and a new window will appear.
Note down the value in the volume Qr which is 'Residual Water Content' equivalent to wilting point. The value represents the water content in 15,000 mbar pressure.
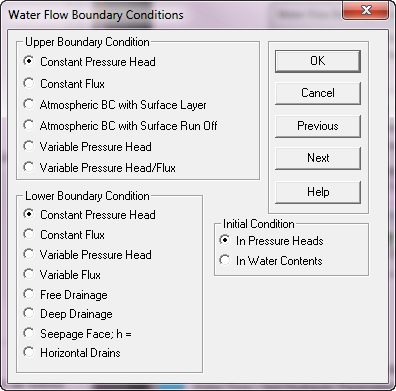
Click ‘Next’, a new window will come up.
In the new window, make sure that the Upper and Lower Boundary Condition is set to ‘Constant Pressure Head’ and Initial Condition is ‘In Pressure Heads’.
Then click Next
Click next and a new window will appear:
Click Next
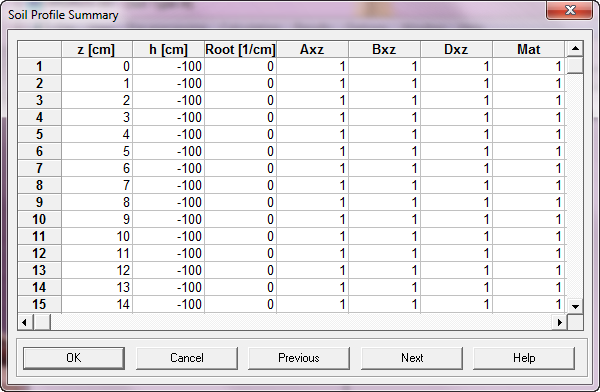
Soil profile summary table will appear
Click Next
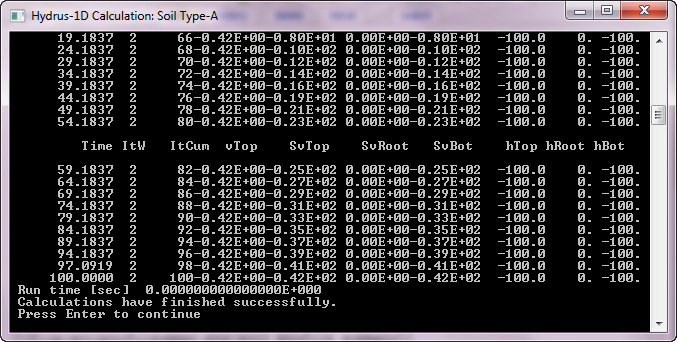
A new window with the following message will appear: 'Do you want to run HYDRUS-1D application?' Click OK
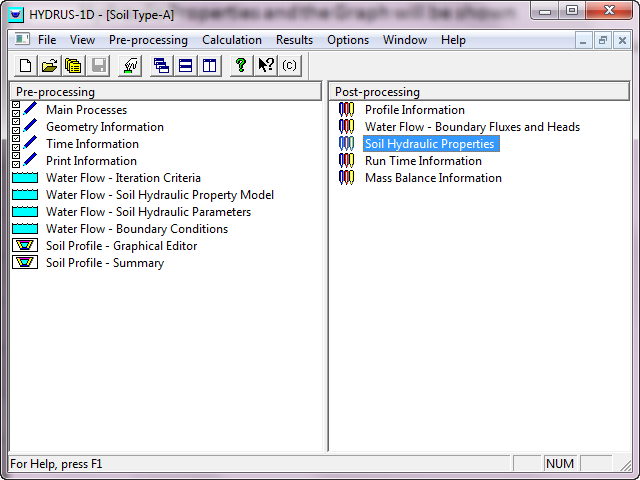
Several outputs will appear in Post-processing window
Press Enter to continue.
Now your data is saved and you will be taken to initial windows.
Double click the Soil Hydraulic Properties and a new graph will appear
Keep the horizontal variable 'pressure head' and verticle 'water content'.
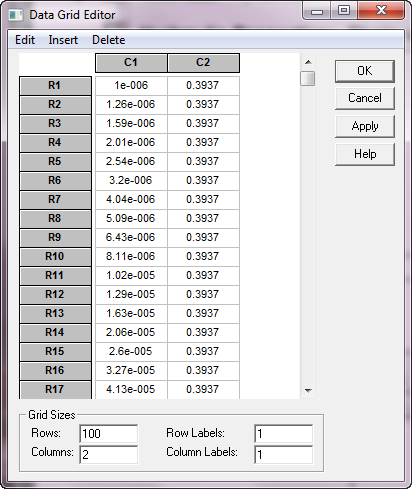
Right click on the graph and click 'Edit Chart Data'.
A new window 'data grid editor' will appear.
The C1 is pressure (mbar) and C2 is water holding capacity (%)
Take a note of the pressure of 0, 59.9 and related water holding capacity. Since, the water content equivalent to 15,000 mbar is not available, the vaule is taken from Qr (Residual Water Content) which has been described earlier. You will get the values 0.39, 0.35 and 0.05 respectively.
By substracting water content value from 60mbar to 0 mbar (i.e. 0.39-0.35 = 0.04) will give the water available in large pore storage. The soil can hold water available in LPS against the gravity. By substracting water content value from 15000 mbar to 60 mbar (i.e. 0.35-0.05 = 0.30) will provide water available in middle pore storage. This state of water availability is also known in field capacity.
The total volume of MPS and LPS can be derived by multiplying MPS and LPS value with respective soil depth (mm) of A horizon. i.e. 150 * 0.30 = 45 (MPS) and 150 * 0.04 = 6 (LPS) as shown in Figure below for A horizon. By considering all the available horizon as shown in the first place, the following information can be derived.
The following MPS values of each horizon have to be equally divided into each 1 dm zone of respective soil horizone in the parameter file as shown in the figure below.
For example in the table above, the value for fc_1 (field capacity:MPS) for first 1 dm is 0.30 because MPS in A horizon (15 cm) is 0.30. The next fc_2 (2 dm) layer is located in between A and B horizon. Therefore, the average has to be taken from the MPS value of A and B horizon (i.e. 0.30+0.31 = 0.305). The MPS value in each 100 mm is converted to 1 dm by multiplying with 100. The MPS value for each dm is provided until 22 dm as shown in figure below.
In this case, the value is provided until fc_9 because the total soil depth is only up to this depth (i.e. 90 cm). Below this depth, there is no soil, therefore, the value is kept zero until fc_22. The air capacity (aircap) is equivalent to large pore storages (LPS) of soil which is 49 in this case. The value for LPS does not need to be divided into the different soil depth. kf_max and kf_min is the maximum and minimum soil conductivity of the soil type. In case these values are not available, users can put the 2 and 1 for maximum and minimum values.
Users has to provide the numerical id for each soil type. For example, the soil type A from the example is provided the id 9 in the parameter file.
