OBIS: Study sites and observations
(→Stations) |
(→Stations) |
||
| Line 47: | Line 47: | ||
[[File:OBIS_Station1.png|600px|options|]] | [[File:OBIS_Station1.png|600px|options|]] | ||
| − | In the section "TS data" you get an overview of timeseries datasets. Listed are dataset title, start and end date, time step, parameter and gaps. The link "show" in the section TS data leads you to the form 'Overall statistics and actions'. See [[ | + | In the section "TS data" you get an overview of timeseries datasets. Listed are dataset title, start and end date, time step, parameter and gaps. The link "show" in the section TS data leads you to the form 'Overall statistics and actions'. See [[/View and download time series data|View and download time series data]]. |
[[File:OBIS_Station2.png|600px|options|]] | [[File:OBIS_Station2.png|600px|options|]] | ||
[[Using_the_Okavango_Basin_Information_System_(OBIS)|[Back to tutorial main page]]] | [[Using_the_Okavango_Basin_Information_System_(OBIS)|[Back to tutorial main page]]] | ||
Revision as of 13:43, 14 March 2013
The data in the OBIS usually linked in many ways. For example stations are linked to river basins, time series and observation. To understand the linkages between all data refer to the chapter OBIS: User interface concepts.
Contents |
Study site
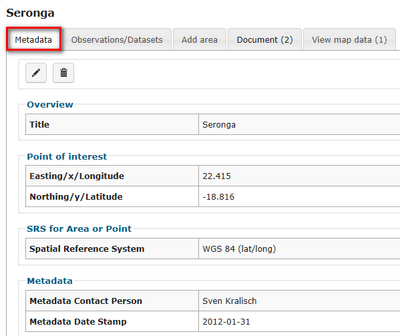
By clicking on the item "study site" an overview of all study sites appears and observations connected to these sites were shown. For further information click on the link "Details" in the row of the entry of interest.
View metadata and connected documents
You get first the metadata information. If observations are available you will find them in the section "Observations/Datasets". In the section "Add area" you have the possibility to upload a shapefile. In the section "Document" files for download are available. "View map data" allows to see the data in the map view.
Generate a new study site
If you want to create a new study site a blank form appears where you have to enter metadata information. After successful submission you have the possibility to link observations, documents or shapefiles to the new compiled study site.
Observation
By clicking on the item "Observation" an overview of all observations appears showing title and type of the observation. For further information click on the link "Details" in the row of the entry of interest. A new form appears, containing the metadata information and linked documents for download.
If you want to enter a new observation, click on "New" in the menu on the left. A blank form appears where you have to enter the metadata. After submission you are able to link the study site, upload datasets and documents.
River system
By clicking on the item "River system" in the menu on the left, an overview of all entries appears. River systems and superordinated river systems are shown. For further information click on the link "Details" in the row of the entry of interest. A new form appears, containing the metadata information and documents linked to the river system. Also you will find a list of stations within the river system. By clicking on the station you will get access to metadata information, all time series measured at this station and linked documents for download. If you want to add a new station, click on "New" in the menu on the left. A blank form appears where you have to enter the metadata. After submission you are able to add time series data and documents.
Stations
By clicking on "Stations" you get a list with the names of all stations. You can put the entries in alphabetical order by using the small arrows in the header of the table. The columns contain next to the station name, the identifier, parameter type (e.g. gauging station, precipitation..) and amount of timeseries data.
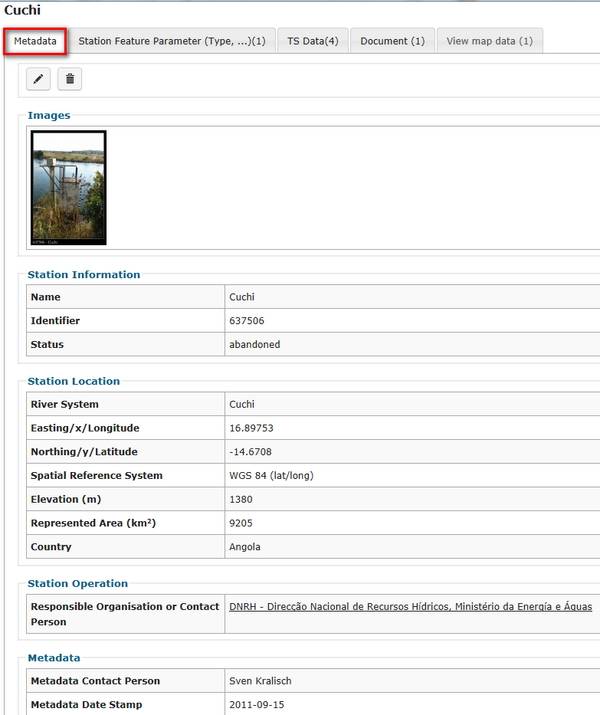
The link "Details" leads you to the metadata sheet of the station. Possibly an image of the station is displayed. In any case you get station information.g. name and identifier. Further you get information about the location of the station, a responsible organisation or person and metadata date stamp and contact person.
In the section "TS data" you get an overview of timeseries datasets. Listed are dataset title, start and end date, time step, parameter and gaps. The link "show" in the section TS data leads you to the form 'Overall statistics and actions'. See View and download time series data.


