ILMSimage 2.4 Miscellaneous
Overview • Project Settings • Cell Creation • Feature Calculation • Classification • Miscellaneous
Panel Control
The Panel Control is designed mainly to control or review the different steps of an ongoing project.
Every process in ILMSimage shows a message, the messages are logged continuously in a file with the same name as the project. The window in the Control panel shows the latest messages.
If Show Properties Table is selected, a click on the [Run] button shows a table with all cell features represented as figures. The first six columns represent internal variables, the next four columns are dedicated to cell size and shape, the remaining columns show the value of chosen features (or attributes). It does not make sense to edit these features using the table. They represent summarized pixel values and cell shapes and must be generated during feature calculation.
The Change Font Size selection box modifies the the font size at once.
Panel Export
During optimization of a classification scheme ILMSimage shows results preferentially as raster layers because transformation to other formats needs some calculation time. The Export panel provides the necessary inputs and parameters to convert and generalize raster image results to vector format.
Convert Feature to Raster Layer converts a single feature to a raster layer in float format.
Multiband raster Layer for All Features does the same as the Show Feature Image checkbox in the Features panel.
Feature name as Text File: deactivated
Export Cell Index as Shape Layer converts all borders of the rasterized cell index to a polygon shape layer. The parameters Smooth Shape Borders and the Optimize Vertex Density allow to get rounded and partial linear vector polygons. The Add Features to Cell Index Table option copies all cell features to the attribute table of the shape file. With a few exceptions the resulting attribute table is identical to the table shown by Show Properties Table command in the Control panel.
Update Cell Index Table was introduced to save time during the optimization phase of a classification session. If the result of the classification should be visualized in vector format and the reference areas are changed without modification of the cell index, classification only modifies the attribute table of the cell index. The attribute table can be recalculated quickly whereas extracting and smoothing of the digitized cell borders needs some time.
Export Classification as Shape Layer generates a shape vector file only with classified polygons. The Smooth Shape Borders and Optimize Vertex Density behaviour is identical to Export cell Index as Shape Layer.
Implementing an Example Application
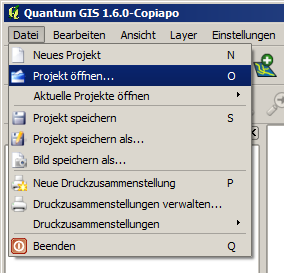
To illustrate the application of the ILMSimage software an example application is shown which examines the catchment area of the Rot in Thuringia. All necessary input data are available to download, so you can understand the example more easily. In this instruction the corresponding file was unpacked into a new directory called C:\ilms_img. To launch the example application, you only have to load the prepared QuantumGIS project C:\ilms_img\rot.qgs under the menu item [File | Open Project...] from the main menu in QuantumGIS.
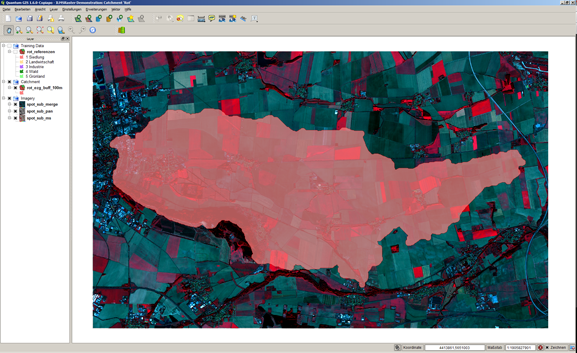
After opening the project you will see the interface of QuantumGIS as shown in the following image. The main part is filled by the mapping of the data. The layer selection box on the left side shows the elements which have been loaded, image data (Imagery), the borders of the catchment area (Catchment) and the reference data (Training Data) which are necessary later on and not yet shown in the map.
Overview • Project Settings • Cell Creation • Feature Calculation • Classification • Miscellaneous

