ILMSImage Classification
(→Defining Reference Areas) |
m |
||
| (20 intermediate revisions by 2 users not shown) | |||
| Line 1: | Line 1: | ||
| − | =[[ | + | [[de:ILMSImage_Classification]] |
| + | [[pt:ILMSImage_Classification]] | ||
| + | =[[File: ilms_img_classification_icon.png|50px|<span title=""></span>]] ILMSImage Classification= | ||
==Introduction== | ==Introduction== | ||
| − | ''ILMSImage Classification'' is part of the [[Tutorial_ILMSImage#ILMSImage_Plug-in_for_QuantumGIS|ILMSImage plug-in for QuantumGIS]] and in this context it carries out a two-step thematic analysis, comprising unsupervised and supervised classification. | + | ''ILMSImage Classification'' is part of the [[Tutorial_ILMSImage#ILMSImage_Plug-in_for_QuantumGIS|ILMSImage plug-in for QuantumGIS]] and in this context it carries out a two-step thematic analysis, comprising unsupervised and supervised classification. |
| − | Like various ILMSImage panels it consists of two components, the ''[[ | + | Like various ILMSImage panels it consists of two components, the ''[[ILMSImage_Cell_Creation#Part_1:_Information|ILMSImage Project Information]]'' in the upper section and the actual tools in the lower section. |
| − | [[ | + | [[File:ilms_img_qgis_work_16.png|Das ILMSImage-Panel zur thematischen Klassifikation]] |
==Thematic Classification== | ==Thematic Classification== | ||
| Line 18: | Line 20: | ||
===Unsupervised Classification into Cell Type Classes=== | ===Unsupervised Classification into Cell Type Classes=== | ||
| − | The unsupervised classification refers to generated geometries during the [[ILMSImage Cell Creation | + | The unsupervised classification refers to generated geometries during the [[ILMSImage Cell Creation|cell creation]] and the [[ILMSImage Attribute Calculation|calculated attributes]] for the geometries to derive cell type classes from both components. They are group of cells which - no matter which geographical location in the image or location to one another - have similar features. Simply put, in this task e.g. elongated and dark cells are separated from those which are rather round and bright - only that the corresponding decision in reality is not limited to the named features but is based on all features generated during attribute calculation. The basic concept of this task therefore corresponds to the partitional cluster analysis ([http://en.wikipedia.org/wiki/Cluster_analysis#Partitional_clustering| Partitional clustering]). |
ILMSImage implements two methods of cluster analysis: | ILMSImage implements two methods of cluster analysis: | ||
| − | # A '''k-Means algorithm''' which represents a frequently used method for finding structures in large amounts of data. The number of clusters of the clusters which should be found is determined beforehand. After a random initialization every cell is assigned to the cluster the central feature vector of which is most similar to that of the cell. If this initial assignment is completed, the cluster centers are recalculated and every cell is compared to existing clusters again. These steps are repeated until none of the assignments change again - | + | # A '''k-Means algorithm''' which represents a frequently used method for finding structures in large amounts of data. The number of clusters of the clusters which should be found is determined beforehand. After a random initialization every cell is assigned to the cluster the central feature vector of which is most similar to that of the cell. If this initial assignment is completed, the cluster centers are recalculated and every cell is compared to existing clusters again. These steps are repeated until none of the assignments change again - the cluster analysis is completed. |
# Another method for partitional clustering is the algorithm of '''[http://en.wikipedia.org/wiki/Self-organizing_map| self-organizing maps]''' which was originally developed by Teuvu Kohonen. It is an artificial neuronal network which is able to project a multi-dimensional feature space functioning as a data source on a two-dimensional range of values. This characteristic explains the relation to the ''map''. The detailed functioning of this algorithm is described at another point. | # Another method for partitional clustering is the algorithm of '''[http://en.wikipedia.org/wiki/Self-organizing_map| self-organizing maps]''' which was originally developed by Teuvu Kohonen. It is an artificial neuronal network which is able to project a multi-dimensional feature space functioning as a data source on a two-dimensional range of values. This characteristic explains the relation to the ''map''. The detailed functioning of this algorithm is described at another point. | ||
| Line 29: | Line 31: | ||
The continuing processing is indicated by a corresponding window. According to the number of selected attributes and to the selected sensitivity the duration of calculation time can vary greatly. After successful completion of the process the user is informed about the number of generated cell type classes: | The continuing processing is indicated by a corresponding window. According to the number of selected attributes and to the selected sensitivity the duration of calculation time can vary greatly. After successful completion of the process the user is informed about the number of generated cell type classes: | ||
| − | [[ | + | [[File:ilms_img_qgis_work_30.png|Benachrichtigungsfenster nach Abschluss der unüberwachten Klassifikation]] |
If the check box ''Unsupervised classification'' stays activated, one click on ''Visualize results'' can load the result of the unsupervised classification into the current map view. The colors used for the visualization are random colors, this is they do not possess any semantic significance in relation to the thematic class of a cell. They only illustrate their common belonging to one cell type class. In the key the raster data layer appears in the group ''ILMSImage Exports'' specified as <code><project name>_sample</code>. | If the check box ''Unsupervised classification'' stays activated, one click on ''Visualize results'' can load the result of the unsupervised classification into the current map view. The colors used for the visualization are random colors, this is they do not possess any semantic significance in relation to the thematic class of a cell. They only illustrate their common belonging to one cell type class. In the key the raster data layer appears in the group ''ILMSImage Exports'' specified as <code><project name>_sample</code>. | ||
| − | [[ | + | [[File:ilms_img_qgis_work_31.png|800px|Im aktuellen QuantumGIS-Projekt visualisiertes Ergebnis der unüberwachten Klassifkation]] |
It should be noted that only one result can exist in this task which can be used for further thematic classification. If such a result has not been visualized after its generation as described above, the raster layer shown in the map view most likely does not correspond to this data basis. | It should be noted that only one result can exist in this task which can be used for further thematic classification. If such a result has not been visualized after its generation as described above, the raster layer shown in the map view most likely does not correspond to this data basis. | ||
| Line 50: | Line 52: | ||
|} | |} | ||
| − | + | The shapefile can have additional fields - to create a valid reference dataset it is sufficient that both of the above-mentioned fields can be found in the attribute table. In this way basically every areal shapefile - including necessary modifications - can be used as reference for ILMSImage. | |
| − | + | In order to facilitate the generation of a new reference data set for the user, the QuantumGIS plug-in makes a corresponding shapefile available which has the right structure and can be complemented with area borders and their attributions. The function can be activated by clicking on ''Create reference layer template'', after the entire section ''Reference data import'' has been activated by using the corresponding check box. The following dialog requests the name of the file which is supposed to be generated (the default setting is <code><project name>_ref</code>) and asks the user to determine the estimated number of thematic classes. This indication is not final, subsequently classes can be added or removed - the only function is to make the determined number of classes (with different visual representation in terms of color) available for the definition of reference areas. | |
| − | [[ | + | [[File:ilms_img_qgis_work_32.png|Auswahldialog zur Erzeugung eines neuen Referenzdatensatzes mit voraussichtlicher Klassenanzahl]] |
| − | + | In case the reference data set which should be generated already exists, the user will be informed and asked to make a decision: | |
| − | [[ | + | [[File:ilms_img_qgis_work_33.png|Benachrichtigung im Falle, dass der zu erzeugende Referenzdatensatz bereits existiert]] |
| − | + | When the layer has been generated, it appears in the level overview of the current QuantumGIS project. There it can also be transferred into an editable mode by right-clicking on and selecting ''Bearbeitungsmodus umschalten'' (change editing mode). This is necessary to register the geometries of the training areas and their attribution into the reference dataset. | |
| − | [[ | + | [[File:ilms_img_qgis_work_34.png|Umschalten in den Bearbeitungsmodus]] |
| − | + | Now the tool ''Polygon digitalisieren'' (digitize polygon) can be used to generate new reference areas. This usually happens when re-accessing original image data; according to the objective and classification scheme also other visualizations can deliver good indications for borders of training areas. The following image illustrates a detail of the generation of a reference area for the class ''Settlement/Siedlung''. | |
<ol> | <ol> | ||
| − | <li> | + | <li>First the support points of the polygon are generated by left-clicking at the corresponding coordinates. It is not necessary to be very precise since ILMSImage is able to separate potential peripheries from central areas of a reference area by statistic criteria. Instead of being accurate it often makes more sense to increase the sample by generating various reference areas for a thematic class. <br/><br/> |
| − | [[ | + | [[File:ilms_img_qgis_work_35.png|400px|Digitalisieren eines Referenzpolygons]]<br/><br/></li> |
| − | <li> | + | <li>When all support points are set, a right-click finishes the digitization of the polygon. The following input mask the class ID and the corresponding description are indicated. It should be noted again that the numbering of classes starts from one and has to be consecutive.<br/><br/> |
| − | [[ | + | [[File:ilms_img_qgis_work_36.png|400px|Maske zur Eingabe der Attribute]]<br/><br/></li> |
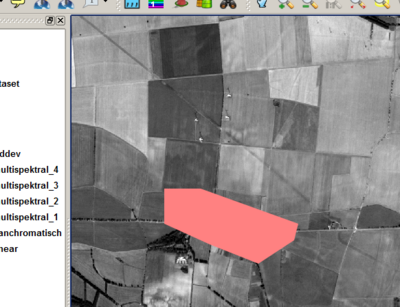
| − | <li> | + | <li>After confirming the input mask, the polygon is shown in the color which is randomly selected for this ID.<br/><br/> |
| − | [[ | + | [[File:ilms_img_qgis_work_37.png|400px|Vollständiges Referenzgebiet in Zufallsfarbendarstellung]]<br/><br/></li> |
| − | <li> | + | <li>It is useful to modify the color of the representation according to the facts, so that either auto-plausibility is established (forest = green, water = blue) or the common usage of certain colors (settlement = red, agriculture = earth-colored) is applied. Using the above-described template means that no longer the entire representation of the layer has to be adjusted but only the color of individual thematic classes. The required window can be accessed by left-clicking on the color which is to be modified. There also the designation can be updated (from ''reference class 1'' to ''Settlement''). <br/><br/> |
| − | [[ | + | [[File:ilms_img_qgis_work_38.png|400px|Fenster zur Änderung von Darstellungsfarbe und Beschreibung]]<br/><br/></li> |
| − | <li> | + | <li>The results is a first reference areas of a specific thematic class, the illustrated example shows the class ''Settlement/Siedlung''.<br/><br/> |
| − | [[ | + | [[File:ilms_img_qgis_work_39.png|400px|Vollständiges Referenzgebiet in dem Sachverhalt angepasster Darstellung]]<br/><br/></li> |
</ol> | </ol> | ||
| − | + | The above-described procedure is repeated until a sufficient number of reference areas has been defined. A repeated switching and confirming the following dialog window back up the reference dataset. If the colors and designations of the classes are modified as well, the example of the Rot shows the following image: | |
| − | [[ | + | [[File:ilms_img_qgis_work_40.png|800px|Vollständig definierter Referenzdatenlayer überlagert über der Grenze des Untersuchungsgebiets]] |
| − | === | + | ===Importing Reference Areas=== |
| − | + | In order to make the defined reference dataset suitable for thematic classification, it has to be imported into the ILMSImage project. This means, first of all, that the data have to be loaded in the current QuantumGIS project - no matter how it has been generated. In the list box ''Reference data layer'' all loaded vector levels are listed which have the above-described structure and are therefore considered importable by ILMSImage. After the layer required has been selected, clicking on ''Conduct classification'' starts the actual import of reference data. This transforms the vector dataset into raster format and added to the attribute list of the cells. This is supposed to happen usually very fast. The complete result can be represented in the current map view by clicking on ''Visualize results''. The result for the above-described example of a reference dataset can be like this (subject to the underlying cell geometries): | |
| − | [[ | + | [[File:ilms_img_qgis_work_41.png|800px|Importierter und visualisierter Referenzdatensatz]] |
| − | + | The process applies the colors used for visualization directly from the representation of the corresponding vector data layer. For a better differentiation of the thematic classes it is recommended to use different colors for them when they are defined. If they are auto-plausible or correspond to common associations (see above), a quick recognition of the reference dataset in raster format - and a subsequent result of the actual classification - is guaranteed. | |
| − | === | + | ===Final Classification=== |
| − | + | The check box ''Supervised classification'' activates the last task in the context of the ILMSImage panel for thematic classification. For this purpose the results of the cluster analysis and of the reference data import are linked to one another. | |
| + | The final result of the classification is available in raster format as a GeoTIFF file to allow maximum comparability. | ||
| − | + | [[File:ilms_img_qgis_work_42.png|800px|Endgültige thematische Klassifikation des Untersuchungsgebiets]] | |
| − | + | ||
| − | [[ | + | |
Latest revision as of 00:52, 13 February 2012
Contents |
 ILMSImage Classification
Introduction
ILMSImage Classification is part of the ILMSImage plug-in for QuantumGIS and in this context it carries out a two-step thematic analysis, comprising unsupervised and supervised classification.
Like various ILMSImage panels it consists of two components, the ILMSImage Project Information in the upper section and the actual tools in the lower section.

Thematic Classification
Background
The process of thematic classification within ILMSImage is composed of three sub-tasks, (1) an unsupervised classification of the existing cells and their features as cell type classes, (2) the definition of reference or training areas using a vector data layer and (3) the actual thematic classification which is based on results of both preceding tasks. Below every step is presented and described in detail.
Unsupervised Classification into Cell Type Classes
The unsupervised classification refers to generated geometries during the cell creation and the calculated attributes for the geometries to derive cell type classes from both components. They are group of cells which - no matter which geographical location in the image or location to one another - have similar features. Simply put, in this task e.g. elongated and dark cells are separated from those which are rather round and bright - only that the corresponding decision in reality is not limited to the named features but is based on all features generated during attribute calculation. The basic concept of this task therefore corresponds to the partitional cluster analysis (Partitional clustering).
ILMSImage implements two methods of cluster analysis:
- A k-Means algorithm which represents a frequently used method for finding structures in large amounts of data. The number of clusters of the clusters which should be found is determined beforehand. After a random initialization every cell is assigned to the cluster the central feature vector of which is most similar to that of the cell. If this initial assignment is completed, the cluster centers are recalculated and every cell is compared to existing clusters again. These steps are repeated until none of the assignments change again - the cluster analysis is completed.
- Another method for partitional clustering is the algorithm of self-organizing maps which was originally developed by Teuvu Kohonen. It is an artificial neuronal network which is able to project a multi-dimensional feature space functioning as a data source on a two-dimensional range of values. This characteristic explains the relation to the map. The detailed functioning of this algorithm is described at another point.
The cells created by ILMSImage and their derived features also represent a multi-dimensional feature space. If this is supposed to be classified in an unsupervised manner, i.e. clustering, this option has to activated in the corresponding part of the ILMSImage classification panel. By Type one of the two above-mentioned method can be selected, the parameter tolerance (range of values from 0.01 to 0.50) controls the sensitivity of the processes. A higher value corresponds to a higher acceptable variability of features within the clusters which are to be generated - hence their number decreases. A low value of tolerance generates a high number of classes since the acceptable variability of features within those is lower.
The continuing processing is indicated by a corresponding window. According to the number of selected attributes and to the selected sensitivity the duration of calculation time can vary greatly. After successful completion of the process the user is informed about the number of generated cell type classes:

If the check box Unsupervised classification stays activated, one click on Visualize results can load the result of the unsupervised classification into the current map view. The colors used for the visualization are random colors, this is they do not possess any semantic significance in relation to the thematic class of a cell. They only illustrate their common belonging to one cell type class. In the key the raster data layer appears in the group ILMSImage Exports specified as <project name>_sample.

It should be noted that only one result can exist in this task which can be used for further thematic classification. If such a result has not been visualized after its generation as described above, the raster layer shown in the map view most likely does not correspond to this data basis.
Defining Reference Areas
Reference and training areas can help the user to define the appropriate classification scheme for his/her objective and convey it to ILMSImage. The separated areas and their attributes are taken from the vector data layer, particularly a shapefile. The attribute table of this file has to correspond to a certain format - to allow correct import - which is described below.
| Field name | Field data type | Description |
|---|---|---|
thema |
Integer | Number for clear identification of the different reference classes. It is important that the counting begins with one and is consecutive. |
desc |
String | Verbal description of the reference class. It is basically a field which is optional information but can be seen as good practice to give names to reference classes which are otherwise only defined by numbers. |
The shapefile can have additional fields - to create a valid reference dataset it is sufficient that both of the above-mentioned fields can be found in the attribute table. In this way basically every areal shapefile - including necessary modifications - can be used as reference for ILMSImage.
In order to facilitate the generation of a new reference data set for the user, the QuantumGIS plug-in makes a corresponding shapefile available which has the right structure and can be complemented with area borders and their attributions. The function can be activated by clicking on Create reference layer template, after the entire section Reference data import has been activated by using the corresponding check box. The following dialog requests the name of the file which is supposed to be generated (the default setting is <project name>_ref) and asks the user to determine the estimated number of thematic classes. This indication is not final, subsequently classes can be added or removed - the only function is to make the determined number of classes (with different visual representation in terms of color) available for the definition of reference areas.

In case the reference data set which should be generated already exists, the user will be informed and asked to make a decision:

When the layer has been generated, it appears in the level overview of the current QuantumGIS project. There it can also be transferred into an editable mode by right-clicking on and selecting Bearbeitungsmodus umschalten (change editing mode). This is necessary to register the geometries of the training areas and their attribution into the reference dataset.

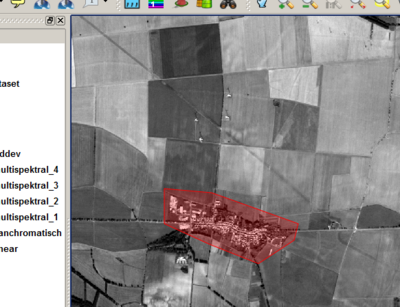
Now the tool Polygon digitalisieren (digitize polygon) can be used to generate new reference areas. This usually happens when re-accessing original image data; according to the objective and classification scheme also other visualizations can deliver good indications for borders of training areas. The following image illustrates a detail of the generation of a reference area for the class Settlement/Siedlung.
- First the support points of the polygon are generated by left-clicking at the corresponding coordinates. It is not necessary to be very precise since ILMSImage is able to separate potential peripheries from central areas of a reference area by statistic criteria. Instead of being accurate it often makes more sense to increase the sample by generating various reference areas for a thematic class.
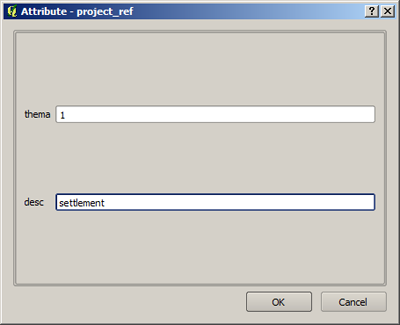
- When all support points are set, a right-click finishes the digitization of the polygon. The following input mask the class ID and the corresponding description are indicated. It should be noted again that the numbering of classes starts from one and has to be consecutive.
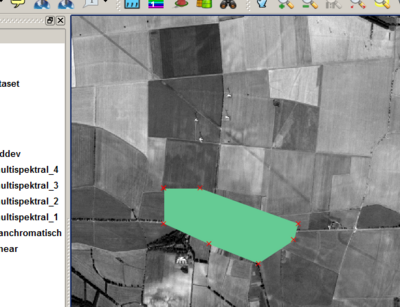
- After confirming the input mask, the polygon is shown in the color which is randomly selected for this ID.
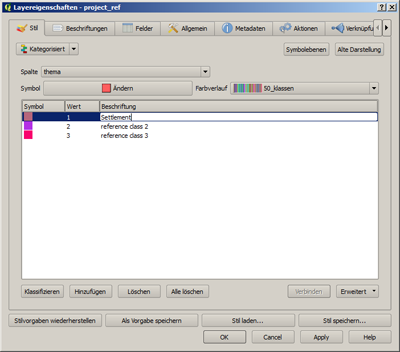
- It is useful to modify the color of the representation according to the facts, so that either auto-plausibility is established (forest = green, water = blue) or the common usage of certain colors (settlement = red, agriculture = earth-colored) is applied. Using the above-described template means that no longer the entire representation of the layer has to be adjusted but only the color of individual thematic classes. The required window can be accessed by left-clicking on the color which is to be modified. There also the designation can be updated (from reference class 1 to Settlement).
- The results is a first reference areas of a specific thematic class, the illustrated example shows the class Settlement/Siedlung.


The above-described procedure is repeated until a sufficient number of reference areas has been defined. A repeated switching and confirming the following dialog window back up the reference dataset. If the colors and designations of the classes are modified as well, the example of the Rot shows the following image:

Importing Reference Areas
In order to make the defined reference dataset suitable for thematic classification, it has to be imported into the ILMSImage project. This means, first of all, that the data have to be loaded in the current QuantumGIS project - no matter how it has been generated. In the list box Reference data layer all loaded vector levels are listed which have the above-described structure and are therefore considered importable by ILMSImage. After the layer required has been selected, clicking on Conduct classification starts the actual import of reference data. This transforms the vector dataset into raster format and added to the attribute list of the cells. This is supposed to happen usually very fast. The complete result can be represented in the current map view by clicking on Visualize results. The result for the above-described example of a reference dataset can be like this (subject to the underlying cell geometries):

The process applies the colors used for visualization directly from the representation of the corresponding vector data layer. For a better differentiation of the thematic classes it is recommended to use different colors for them when they are defined. If they are auto-plausible or correspond to common associations (see above), a quick recognition of the reference dataset in raster format - and a subsequent result of the actual classification - is guaranteed.
Final Classification
The check box Supervised classification activates the last task in the context of the ILMSImage panel for thematic classification. For this purpose the results of the cluster analysis and of the reference data import are linked to one another.
The final result of the classification is available in raster format as a GeoTIFF file to allow maximum comparability.
